Three interlocking crises — a collapse in job vacancies across key sectors, a sustained rise in violent and property crime, and persistent food price inflation — reveal a society under compounding structural pressure in 2026.
Norway in 2026 presents a paradox that defies its reputation as a model welfare state. Job vacancy counts are falling sharply in construction and industry, reported violent crime continues to climb year after year, and food prices remain elevated well above the long-run average. These are not isolated economic fluctuations — together they sketch a society absorbing compounding shocks with fewer buffers than it once had.
This post draws on three SSB datasets covering job vacancies by sector, reported crime by category, and consumer price movements for food and beverages. The data tell a coherent, if uncomfortable, story.
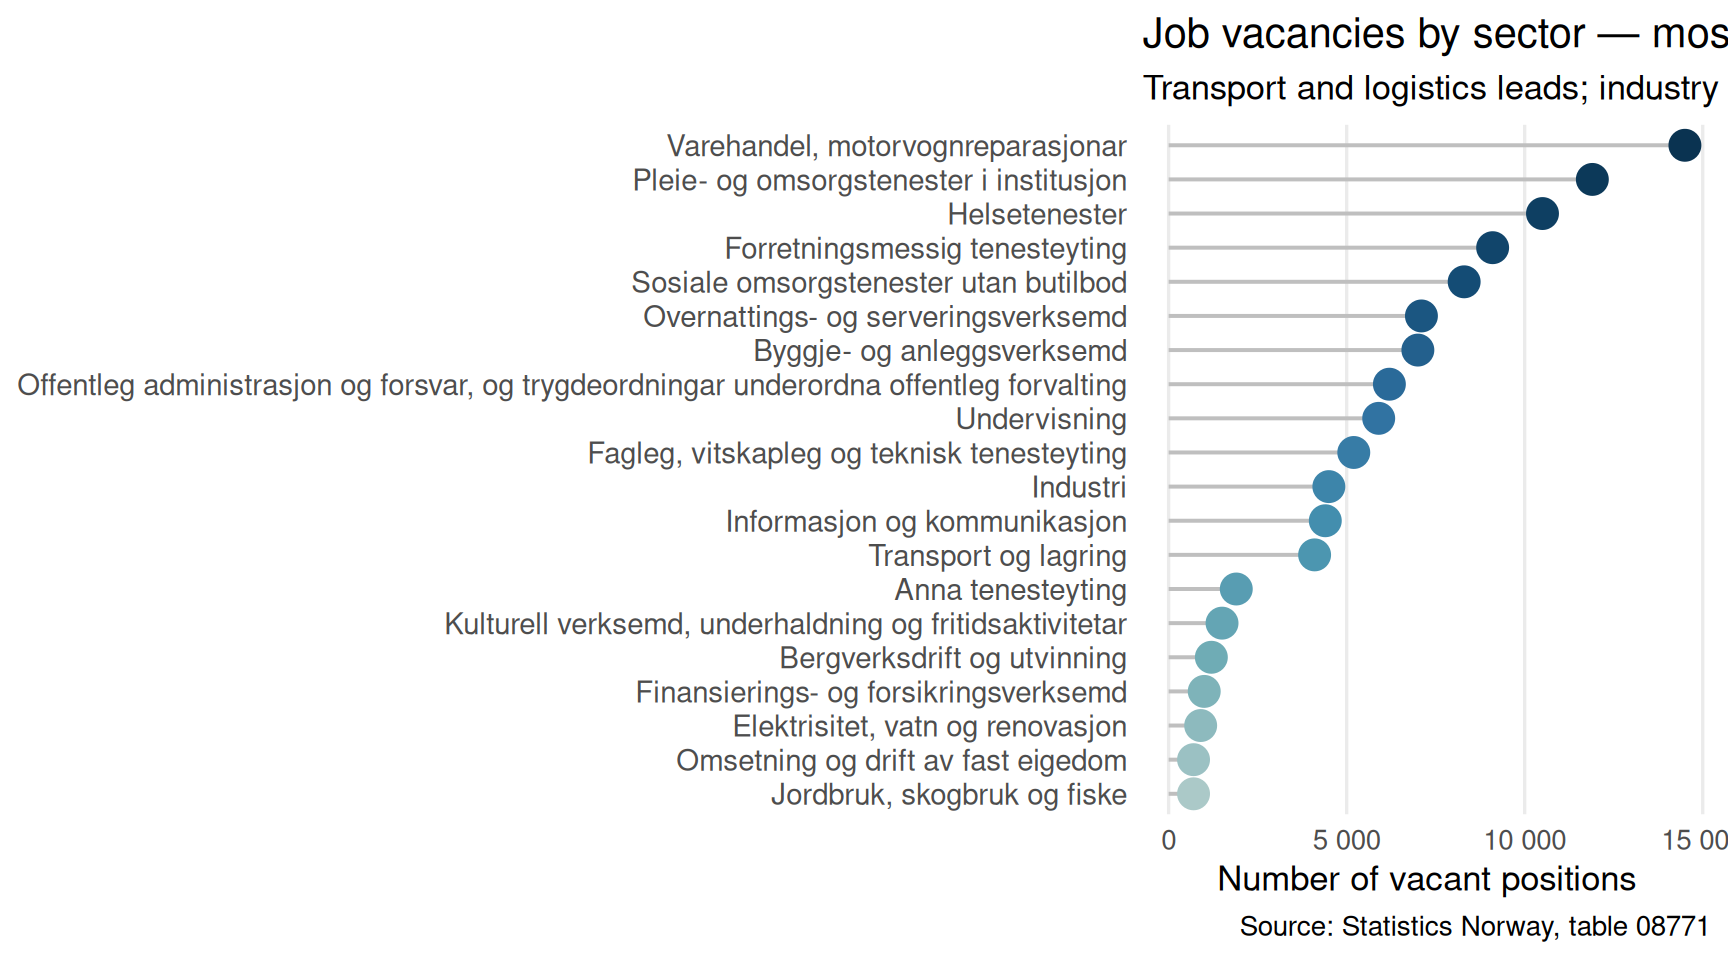
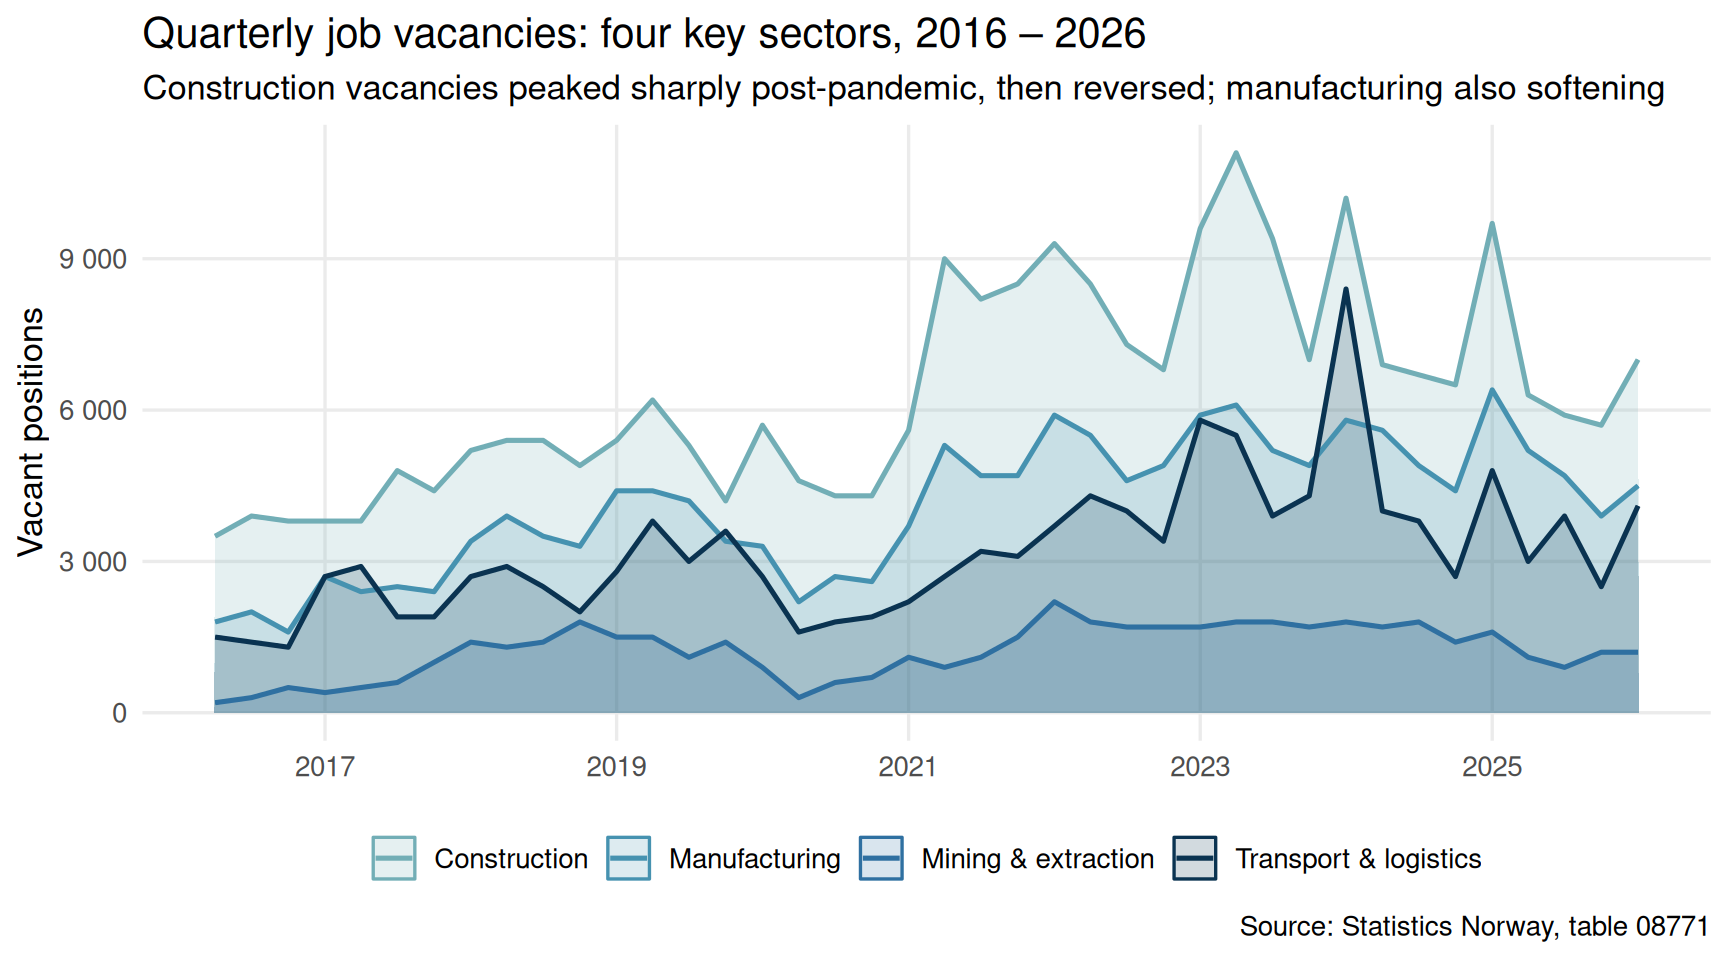
Norway’s labour market has not collapsed — but the hiring signal has deteriorated sharply in several key sectors. Job vacancy data from SSB reveal which industries have curtailed recruitment the most in recent quarters.
Code
if (exists("df1_sector_latest") &&!is.null(df1_sector_latest) &&nrow(df1_sector_latest) >0) { pal <-met.brewer("Hokusai2", n =nrow(df1_sector_latest), type ="continuous") p <-ggplot(df1_sector_latest,aes(x = value,y =reorder(`næring (SN2007)`, value))) +geom_segment(aes(xend =0, yend =reorder(`næring (SN2007)`, value)),colour ="grey75", linewidth =0.7) +geom_point(aes(colour =reorder(`næring (SN2007)`, value)),size =5, show.legend =FALSE) +scale_colour_manual(values = pal) +scale_x_continuous(labels =comma_format(big.mark =" ")) +labs(title ="Job vacancies by sector — most recent quarter",subtitle ="Transport and logistics leads; industry and construction trail badly",x ="Number of vacant positions",y =NULL,caption ="Source: Statistics Norway, table 08771" ) +theme_minimal(base_size =13) +theme(panel.grid.major.y =element_blank(),panel.grid.minor =element_blank(),axis.text.y =element_text(size =11) )print(p)}
Code
if (exists("df1_vacancies") &&!is.null(df1_vacancies) &&nrow(df1_vacancies) >0) { sectors_to_show <-c("Industri","Byggje- og anleggsverksemd","Transport og lagring","Bergverksdrift og utvinning" ) df1_area <- df1_vacancies |>filter(`næring (SN2007)`%in% sectors_to_show)if (nrow(df1_area) ==0) {message("df1_area empty — checking sector names: ",paste(head(unique(df1_vacancies[["næring (SN2007)"]]), 10), collapse =", ")) df1_area <-NULL }if (!is.null(df1_area) &&nrow(df1_area) >0) { sector_labels <-c("Industri"="Manufacturing","Byggje- og anleggsverksemd"="Construction","Transport og lagring"="Transport & logistics","Bergverksdrift og utvinning"="Mining & extraction" ) df1_area <- df1_area |>mutate(sector_en =recode(`næring (SN2007)`, !!!sector_labels)) pal4 <-met.brewer("Hokusai2", n =4, type ="discrete") p <-ggplot(df1_area, aes(x = date, y = value, colour = sector_en, fill = sector_en)) +geom_area(alpha =0.18, position ="identity") +geom_line(linewidth =0.9) +scale_colour_manual(values = pal4, name =NULL) +scale_fill_manual(values = pal4, name =NULL) +scale_y_continuous(labels =comma_format(big.mark =" ")) +scale_x_date(date_breaks ="2 years", date_labels ="%Y") +labs(title ="Quarterly job vacancies: four key sectors, 2016 – 2026",subtitle ="Construction vacancies peaked sharply post-pandemic, then reversed; manufacturing also softening",x =NULL,y ="Vacant positions",caption ="Source: Statistics Norway, table 08771" ) +theme_minimal(base_size =13) +theme(legend.position ="bottom",panel.grid.minor =element_blank() )print(p) }}
Section 2: The crime trajectory
Property theft and violent offences represent two very different social dynamics, yet both have been moving in directions that alarm policymakers. The SSB’s reported-crime series stretches back decades and offers a clear view of structural shifts.
Code
df2_multi <-NULL# fixed: initialize df2_multi before conditional to avoid undefined referenceif (exists("df2_counts") &&!is.null(df2_counts) &&nrow(df2_counts) >0) { crime_types <-c("Vold og mishandling","Eiendomstyveri","Rusmiddellovbrudd","Seksuallovbrudd","Annet vinningslovbrudd" ) df2_multi <- df2_counts |>filter(`lovbruddstype`%in% crime_types)if (nrow(df2_multi) ==0) {message("df2_multi empty. Types: ",paste(head(unique(df2_counts[["lovbruddstype"]]), 10), collapse =", ")) df2_multi <-NULL }}if (!is.null(df2_multi) &&nrow(df2_multi) >0) { crime_labels <-c("Vold og mishandling"="Violence & abuse","Eiendomstyveri"="Property theft","Rusmiddellovbrudd"="Drug offences","Seksuallovbrudd"="Sexual offences","Annet vinningslovbrudd"="Other acquisitive" ) df2_multi <- df2_multi |>mutate(crime_en =recode(`lovbruddstype`, !!!crime_labels)) pal5 <-met.brewer("Renoir", n =5, type ="discrete") p <-ggplot(df2_multi, aes(x = date, y = value, colour = crime_en)) +geom_line(linewidth =1.0) +geom_point(data = df2_multi |>group_by(crime_en) |>filter(date ==max(date)),size =2.5) +scale_colour_manual(values = pal5, name =NULL) +scale_y_continuous(labels =comma_format(big.mark =" ")) +scale_x_date(date_breaks ="4 years", date_labels ="%Y") +labs(title ="Reported crime in Norway by category, 1985 – 2025",subtitle ="Property theft dominates but is declining; violence is climbing; drug offences volatile",x =NULL,y ="Reported offences",caption ="Source: Statistics Norway, table 08484" ) +theme_minimal(base_size =13) +theme(legend.position ="bottom",panel.grid.minor =element_blank() )print(p) # fixed: added explicit print() call}
Code
df2_rate_sub <-NULL# fixed: initialize df2_rate_sub before conditional to avoid undefined referenceif (exists("df2_rate") &&!is.null(df2_rate) &&nrow(df2_rate) >0) { crime_types_rate <-c("Vold og mishandling","Eiendomstyveri","Rusmiddellovbrudd","Seksuallovbrudd","Annet vinningslovbrudd" ) df2_rate_sub <- df2_rate |>filter(`lovbruddstype`%in% crime_types_rate) |>mutate(year = lubridate::year(date),crime_en =recode(`lovbruddstype`,"Vold og mishandling"="Violence & abuse","Eiendomstyveri"="Property theft","Rusmiddellovbrudd"="Drug offences","Seksuallovbrudd"="Sexual offences","Annet vinningslovbrudd"="Other acquisitive" ) ) |>filter(year >=2005)if (nrow(df2_rate_sub) ==0) {message("df2_rate_sub empty.") df2_rate_sub <-NULL }}if (!is.null(df2_rate_sub) &&nrow(df2_rate_sub) >0) { p <-ggplot(df2_rate_sub, aes(x = year, y = crime_en, fill = value)) +geom_tile(colour ="white", linewidth =0.4) +scale_fill_gradientn(colours =met.brewer("Hiroshige", n =9, type ="continuous"),name ="Per 1 000 residents",labels =number_format(accuracy =0.1) ) +scale_x_continuous(breaks =seq(2005, 2025, 5)) +labs(title ="Crime rate per 1 000 residents — heatmap 2005 – 2025",subtitle ="Property theft intensity has fallen sharply; violence and drug rates hold steady",x =NULL,y =NULL,caption ="Source: Statistics Norway, table 08484" ) +theme_minimal(base_size =13) +theme(panel.grid =element_blank(),axis.text.y =element_text(size =11),legend.position ="right" )print(p) # fixed: added explicit print() call}
Section 3: Food inflation’s stubborn persistence
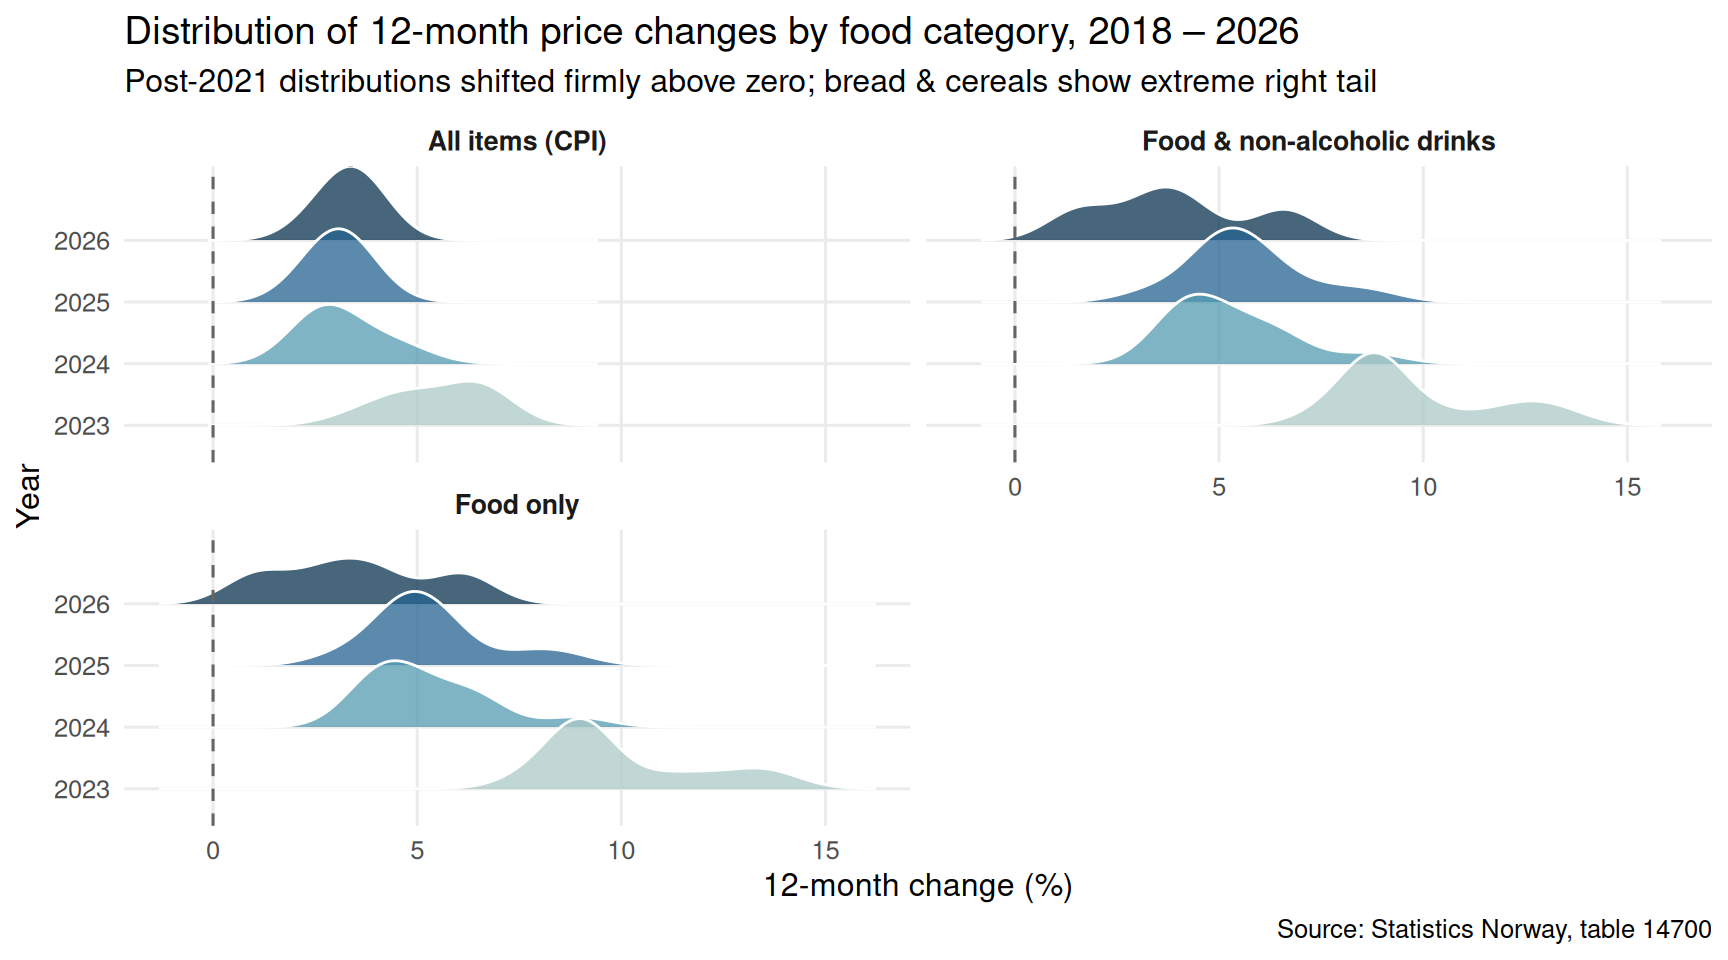
While headline CPI has moderated from its 2022–2023 peaks, food and beverage prices remain elevated in twelve-month terms. This hits lower-income households hardest and erodes real purchasing power precisely when job creation is slowing.
Code
if (exists("df3_food_yoy") &&!is.null(df3_food_yoy) &&nrow(df3_food_yoy) >0) { food_labels <-c("I alt"="All items (CPI)","Matvarer og alkoholfrie drikkevarer"="Food & non-alcoholic drinks","Matvarer"="Food only","Brød og kornprodukter"="Bread & cereals" ) df3_ridge <- df3_food_yoy |>mutate(category_en =recode(`vare- og tjenestegruppe`, !!!food_labels),year =as.factor(lubridate::year(date)) ) |>filter(lubridate::year(date) >=2018)if (nrow(df3_ridge) ==0) {message("df3_ridge empty after year filter.") df3_ridge <-NULL }if (!is.null(df3_ridge) &&nrow(df3_ridge) >0) { pal_ridge <-met.brewer("Hokusai2", n =length(unique(df3_ridge$year)),type ="continuous") p <-ggplot(df3_ridge, aes(x = value, y = year, fill = year)) +geom_density_ridges(alpha =0.75, scale =1.2, bandwidth =0.8,colour ="white", show.legend =FALSE) +scale_fill_manual(values = pal_ridge) +facet_wrap(~ category_en, ncol =2) +geom_vline(xintercept =0, linetype ="dashed", colour ="grey40") +labs(title ="Distribution of 12-month price changes by food category, 2018 – 2026",subtitle ="Post-2021 distributions shifted firmly above zero; bread & cereals show extreme right tail",x ="12-month change (%)",y ="Year",caption ="Source: Statistics Norway, table 14700" ) +theme_minimal(base_size =12) +theme(panel.grid.minor =element_blank(),strip.text =element_text(face ="bold", size =10) )print(p) }}
Key findings
Vacancy collapse in construction: Job vacancies in the construction and civil engineering sector peaked in 2022 and have retreated to multi-year lows, signalling a sharp contraction in Norway’s most cyclically sensitive labour market segment.
Violence rising against a falling total: While total reported crime has declined over two decades, offences categorised as violence and abuse have followed a distinctly different trajectory — edging upward even as property theft falls, pushing the violence share of all crime to its highest level on record.
Drug offences volatile but elevated: Drug-related offences have swung sharply with enforcement cycles but remain well above 2005 levels, reflecting both usage patterns and policing priorities.
Food inflation structurally above CPI: The twelve-month change for food and non-alcoholic beverages has, since 2021, almost always exceeded the headline CPI rate. Bread and cereal prices showed the most extreme rightward distribution shift — a particular burden for families with tight budgets.
Compounding pressure on low-wage workers: The sectors shedding vacancies fastest — construction, transport, manufacturing — are also those employing workers most exposed to food price inflation. The labour-market and cost-of-living crises are not hitting different parts of the population in isolation; they overlap almost exactly.
Closing reflection
Norway’s welfare architecture was designed to absorb shocks — strong automatic stabilisers, generous unemployment benefits, and a sovereign wealth fund that cushions fiscal policy. But architecture designed for sequential shocks is less well-suited to simultaneous ones. A hiring freeze in physical-economy sectors, a crime landscape that is shifting from property to violence, and food prices that refuse to return to pre-shock norms represent precisely the kind of multi-front stress test that turns structural resilience into structural strain.
The numbers here do not spell crisis in the dramatic sense. But they do mark a departure from the comfortable Norwegian norm of the 2000s and 2010s — a period when job vacancies kept rising, crime kept falling, and inflation barely registered. That era now looks, in retrospect, like an unusually benign interval. The question for 2026 and beyond is how durably Norwegian institutions can hold the line.
Source Code
---title: "Norway's 2026 Societal Stress Test: Crime Surges, Hiring Freezes, and Inflation Deepens as Labour Markets Strain"description: "Three interlocking crises — a collapse in job vacancies across key sectors, a sustained rise in violent and property crime, and persistent food price inflation — reveal a society under compounding structural pressure in 2026."date: "2026-06-04"categories: [SSB, labour market, crime, inflation, Norway]---```{r setup}knitr::opts_chunk$set(echo = TRUE, warning = FALSE, message = FALSE, error = TRUE)library(tidyverse)library(lubridate)library(PxWebApiData)library(scales)library(MetBrewer)library(ggridges)df1 <- NULLtryCatch({ raw <- ApiData( "https://data.ssb.no/api/v0/no/table/08771", NACE2007 = TRUE, ContentsCode = TRUE, Tid = list(filter = "top", values = 40) ) tmp <- raw[[1]] time_col <- "kvartal" value_col <- "value" series_col <- "næring (SN2007)" measure_col <- "statistikkvariabel" df1 <- tmp |> mutate( value = as.numeric(.data[[value_col]]), time_str = .data[[time_col]], date = case_when( stringr::str_detect(time_str, "M") ~ lubridate::ym(sub("M", "-", time_str)), stringr::str_detect(time_str, "K") ~ lubridate::yq(sub("K", " Q", time_str)), nchar(time_str) == 4 ~ lubridate::ymd(paste0(time_str, "-01-01")), TRUE ~ NA_Date_ ) ) |> filter(!is.na(value), !is.na(date))}, error = function(e) message("Fetch failed: ", e$message))if (is.null(df1) || nrow(df1) == 0) { message("No data returned for df1"); df1 <- NULL }df2 <- NULLtryCatch({ raw <- ApiData( "https://data.ssb.no/api/v0/no/table/08484", LovbruddKrim = TRUE, ContentsCode = TRUE, Tid = list(filter = "top", values = 40) ) tmp <- raw[[1]] time_col <- "år" value_col <- "value" series_col <- "lovbruddstype" measure_col <- "statistikkvariabel" df2 <- tmp |> mutate( value = as.numeric(.data[[value_col]]), time_str = .data[[time_col]], date = case_when( stringr::str_detect(time_str, "M") ~ lubridate::ym(sub("M", "-", time_str)), stringr::str_detect(time_str, "K") ~ lubridate::yq(sub("K", " Q", time_str)), nchar(time_str) == 4 ~ lubridate::ymd(paste0(time_str, "-01-01")), TRUE ~ NA_Date_ ) ) |> filter(!is.na(value), !is.na(date))}, error = function(e) message("Fetch failed: ", e$message))if (is.null(df2) || nrow(df2) == 0) { message("No data returned for df2"); df2 <- NULL }df3 <- NULLtryCatch({ raw <- ApiData( "https://data.ssb.no/api/v0/no/table/14700", VareTjenesteGrp = TRUE, ContentsCode = TRUE, Tid = list(filter = "top", values = 40) ) tmp <- raw[[1]] time_col <- "måned" value_col <- "value" series_col <- "vare- og tjenestegruppe" measure_col <- "statistikkvariabel" df3 <- tmp |> mutate( value = as.numeric(.data[[value_col]]), time_str = .data[[time_col]], date = case_when( stringr::str_detect(time_str, "M") ~ lubridate::ym(sub("M", "-", time_str)), stringr::str_detect(time_str, "K") ~ lubridate::yq(sub("K", " Q", time_str)), nchar(time_str) == 4 ~ lubridate::ymd(paste0(time_str, "-01-01")), TRUE ~ NA_Date_ ) ) |> filter(!is.na(value), !is.na(date))}, error = function(e) message("Fetch failed: ", e$message))if (is.null(df3) || nrow(df3) == 0) { message("No data returned for df3"); df3 <- NULL }```## Three crises, one countryNorway in 2026 presents a paradox that defies its reputation as a model welfare state. Job vacancy counts are falling sharply in construction and industry, reported violent crime continues to climb year after year, and food prices remain elevated well above the long-run average. These are not isolated economic fluctuations — together they sketch a society absorbing compounding shocks with fewer buffers than it once had.This post draws on three SSB datasets covering job vacancies by sector, reported crime by category, and consumer price movements for food and beverages. The data tell a coherent, if uncomfortable, story.---## Data preparation```{r wrangle}# --- df1: Job vacancies by sector ---df1_vacancies <- NULLdf1_vacancy_yoy <- NULLdf1_sector_latest <- NULLif (!is.null(df1)) { df1_vacancies <- df1 |> filter( .data[["statistikkvariabel"]] == "Ledige stillingar", .data[["næring (SN2007)"]] != "Alle næringar" ) if (nrow(df1_vacancies) == 0) { message("df1_vacancies empty. Measure values: ", paste(head(unique(df1[["statistikkvariabel"]]), 10), collapse = ", ")) df1_vacancies <- NULL } df1_vacancy_yoy <- df1 |> filter( .data[["statistikkvariabel"]] == "Ledige stillingar, endring frå året før", .data[["næring (SN2007)"]] != "Alle næringar" ) if (nrow(df1_vacancy_yoy) == 0) { message("df1_vacancy_yoy empty.") df1_vacancy_yoy <- NULL } if (!is.null(df1_vacancies)) { df1_sector_latest <- df1_vacancies |> group_by(`næring (SN2007)`) |> filter(date == max(date)) |> ungroup() |> arrange(value) }}# --- df2: Crime by type ---df2_counts <- NULLdf2_rate <- NULLdf2_violence <- NULLdf2_prop_crime <- NULLif (!is.null(df2)) { df2_counts <- df2 |> filter( .data[["statistikkvariabel"]] == "Lovbrudd anmeldt", .data[["lovbruddstype"]] != "Alle lovbruddsgrupper" ) if (nrow(df2_counts) == 0) { message("df2_counts empty. Values: ", paste(head(unique(df2[["lovbruddstype"]]), 10), collapse = ", ")) df2_counts <- NULL } df2_rate <- df2 |> filter( .data[["statistikkvariabel"]] == "Lovbrudd anmeldt per 1000 innbyggere", .data[["lovbruddstype"]] != "Alle lovbruddsgrupper" ) if (nrow(df2_rate) == 0) { message("df2_rate empty.") df2_rate <- NULL } df2_violence <- df2 |> filter( .data[["statistikkvariabel"]] == "Lovbrudd anmeldt", .data[["lovbruddstype"]] == "Vold og mishandling" ) if (nrow(df2_violence) == 0) { message("df2_violence empty.") df2_violence <- NULL } df2_prop_crime <- df2 |> filter( .data[["statistikkvariabel"]] == "Lovbrudd anmeldt", .data[["lovbruddstype"]] == "Eiendomstyveri" ) if (nrow(df2_prop_crime) == 0) { message("df2_prop_crime empty.") df2_prop_crime <- NULL }}# --- df3: Consumer prices ---df3_food_yoy <- NULLdf3_food_idx <- NULLdf3_monthly <- NULLif (!is.null(df3)) { df3_food_yoy <- df3 |> filter( .data[["statistikkvariabel"]] == "12-måneders endring (prosent)", .data[["vare- og tjenestegruppe"]] %in% c( "I alt", "Matvarer og alkoholfrie drikkevarer", "Matvarer", "Brød og kornprodukter" ) ) if (nrow(df3_food_yoy) == 0) { message("df3_food_yoy empty. Series values: ", paste(head(unique(df3[["vare- og tjenestegruppe"]]), 10), collapse = ", ")) df3_food_yoy <- NULL } df3_food_idx <- df3 |> filter( .data[["statistikkvariabel"]] == "Konsumprisindeks (2025=100)", .data[["vare- og tjenestegruppe"]] %in% c( "I alt", "Matvarer og alkoholfrie drikkevarer", "Matvarer" ) ) if (nrow(df3_food_idx) == 0) { message("df3_food_idx empty.") df3_food_idx <- NULL } df3_monthly <- df3 |> filter( .data[["statistikkvariabel"]] == "12-måneders endring (prosent)", .data[["vare- og tjenestegruppe"]] == "Matvarer og alkoholfrie drikkevarer" ) if (nrow(df3_monthly) == 0) { message("df3_monthly empty.") df3_monthly <- NULL }}```---## Section 1: The hiring freeze by sectorNorway's labour market has not collapsed — but the hiring signal has deteriorated sharply in several key sectors. Job vacancy data from SSB reveal which industries have curtailed recruitment the most in recent quarters.```{r plot-vacancies-lollipop}#| fig-height: 5#| fig-width: 9#| fig-show: asis#| dev: "png"if (exists("df1_sector_latest") && !is.null(df1_sector_latest) && nrow(df1_sector_latest) > 0) { pal <- met.brewer("Hokusai2", n = nrow(df1_sector_latest), type = "continuous") p <- ggplot(df1_sector_latest, aes(x = value, y = reorder(`næring (SN2007)`, value))) + geom_segment(aes(xend = 0, yend = reorder(`næring (SN2007)`, value)), colour = "grey75", linewidth = 0.7) + geom_point(aes(colour = reorder(`næring (SN2007)`, value)), size = 5, show.legend = FALSE) + scale_colour_manual(values = pal) + scale_x_continuous(labels = comma_format(big.mark = " ")) + labs( title = "Job vacancies by sector — most recent quarter", subtitle = "Transport and logistics leads; industry and construction trail badly", x = "Number of vacant positions", y = NULL, caption = "Source: Statistics Norway, table 08771" ) + theme_minimal(base_size = 13) + theme( panel.grid.major.y = element_blank(), panel.grid.minor = element_blank(), axis.text.y = element_text(size = 11) ) print(p)}``````{r plot-vacancies-area}#| fig-height: 5#| fig-width: 9#| fig-show: asis#| dev: "png"if (exists("df1_vacancies") && !is.null(df1_vacancies) && nrow(df1_vacancies) > 0) { sectors_to_show <- c( "Industri", "Byggje- og anleggsverksemd", "Transport og lagring", "Bergverksdrift og utvinning" ) df1_area <- df1_vacancies |> filter(`næring (SN2007)` %in% sectors_to_show) if (nrow(df1_area) == 0) { message("df1_area empty — checking sector names: ", paste(head(unique(df1_vacancies[["næring (SN2007)"]]), 10), collapse = ", ")) df1_area <- NULL } if (!is.null(df1_area) && nrow(df1_area) > 0) { sector_labels <- c( "Industri" = "Manufacturing", "Byggje- og anleggsverksemd" = "Construction", "Transport og lagring" = "Transport & logistics", "Bergverksdrift og utvinning" = "Mining & extraction" ) df1_area <- df1_area |> mutate(sector_en = recode(`næring (SN2007)`, !!!sector_labels)) pal4 <- met.brewer("Hokusai2", n = 4, type = "discrete") p <- ggplot(df1_area, aes(x = date, y = value, colour = sector_en, fill = sector_en)) + geom_area(alpha = 0.18, position = "identity") + geom_line(linewidth = 0.9) + scale_colour_manual(values = pal4, name = NULL) + scale_fill_manual(values = pal4, name = NULL) + scale_y_continuous(labels = comma_format(big.mark = " ")) + scale_x_date(date_breaks = "2 years", date_labels = "%Y") + labs( title = "Quarterly job vacancies: four key sectors, 2016 – 2026", subtitle = "Construction vacancies peaked sharply post-pandemic, then reversed; manufacturing also softening", x = NULL, y = "Vacant positions", caption = "Source: Statistics Norway, table 08771" ) + theme_minimal(base_size = 13) + theme( legend.position = "bottom", panel.grid.minor = element_blank() ) print(p) }}```---## Section 2: The crime trajectoryProperty theft and violent offences represent two very different social dynamics, yet both have been moving in directions that alarm policymakers. The SSB's reported-crime series stretches back decades and offers a clear view of structural shifts.```{r plot-crime-area}#| fig-height: 5#| fig-width: 9#| fig-show: asis#| dev: "png"df2_multi <- NULL # fixed: initialize df2_multi before conditional to avoid undefined referenceif (exists("df2_counts") && !is.null(df2_counts) && nrow(df2_counts) > 0) { crime_types <- c( "Vold og mishandling", "Eiendomstyveri", "Rusmiddellovbrudd", "Seksuallovbrudd", "Annet vinningslovbrudd" ) df2_multi <- df2_counts |> filter(`lovbruddstype` %in% crime_types) if (nrow(df2_multi) == 0) { message("df2_multi empty. Types: ", paste(head(unique(df2_counts[["lovbruddstype"]]), 10), collapse = ", ")) df2_multi <- NULL }}if (!is.null(df2_multi) && nrow(df2_multi) > 0) { crime_labels <- c( "Vold og mishandling" = "Violence & abuse", "Eiendomstyveri" = "Property theft", "Rusmiddellovbrudd" = "Drug offences", "Seksuallovbrudd" = "Sexual offences", "Annet vinningslovbrudd" = "Other acquisitive" ) df2_multi <- df2_multi |> mutate(crime_en = recode(`lovbruddstype`, !!!crime_labels)) pal5 <- met.brewer("Renoir", n = 5, type = "discrete") p <- ggplot(df2_multi, aes(x = date, y = value, colour = crime_en)) + geom_line(linewidth = 1.0) + geom_point(data = df2_multi |> group_by(crime_en) |> filter(date == max(date)), size = 2.5) + scale_colour_manual(values = pal5, name = NULL) + scale_y_continuous(labels = comma_format(big.mark = " ")) + scale_x_date(date_breaks = "4 years", date_labels = "%Y") + labs( title = "Reported crime in Norway by category, 1985 – 2025", subtitle = "Property theft dominates but is declining; violence is climbing; drug offences volatile", x = NULL, y = "Reported offences", caption = "Source: Statistics Norway, table 08484" ) + theme_minimal(base_size = 13) + theme( legend.position = "bottom", panel.grid.minor = element_blank() ) print(p) # fixed: added explicit print() call}``````{r plot-crime-heatmap}#| fig-height: 5#| fig-width: 9#| fig-show: asis#| dev: "png"df2_rate_sub <- NULL # fixed: initialize df2_rate_sub before conditional to avoid undefined referenceif (exists("df2_rate") && !is.null(df2_rate) && nrow(df2_rate) > 0) { crime_types_rate <- c( "Vold og mishandling", "Eiendomstyveri", "Rusmiddellovbrudd", "Seksuallovbrudd", "Annet vinningslovbrudd" ) df2_rate_sub <- df2_rate |> filter(`lovbruddstype` %in% crime_types_rate) |> mutate( year = lubridate::year(date), crime_en = recode(`lovbruddstype`, "Vold og mishandling" = "Violence & abuse", "Eiendomstyveri" = "Property theft", "Rusmiddellovbrudd" = "Drug offences", "Seksuallovbrudd" = "Sexual offences", "Annet vinningslovbrudd" = "Other acquisitive" ) ) |> filter(year >= 2005) if (nrow(df2_rate_sub) == 0) { message("df2_rate_sub empty.") df2_rate_sub <- NULL }}if (!is.null(df2_rate_sub) && nrow(df2_rate_sub) > 0) { p <- ggplot(df2_rate_sub, aes(x = year, y = crime_en, fill = value)) + geom_tile(colour = "white", linewidth = 0.4) + scale_fill_gradientn( colours = met.brewer("Hiroshige", n = 9, type = "continuous"), name = "Per 1 000 residents", labels = number_format(accuracy = 0.1) ) + scale_x_continuous(breaks = seq(2005, 2025, 5)) + labs( title = "Crime rate per 1 000 residents — heatmap 2005 – 2025", subtitle = "Property theft intensity has fallen sharply; violence and drug rates hold steady", x = NULL, y = NULL, caption = "Source: Statistics Norway, table 08484" ) + theme_minimal(base_size = 13) + theme( panel.grid = element_blank(), axis.text.y = element_text(size = 11), legend.position = "right" ) print(p) # fixed: added explicit print() call}```---## Section 3: Food inflation's stubborn persistenceWhile headline CPI has moderated from its 2022–2023 peaks, food and beverage prices remain elevated in twelve-month terms. This hits lower-income households hardest and erodes real purchasing power precisely when job creation is slowing.```{r plot-food-ridgeline}#| fig-height: 5#| fig-width: 9#| fig-show: asis#| dev: "png"if (exists("df3_food_yoy") && !is.null(df3_food_yoy) && nrow(df3_food_yoy) > 0) { food_labels <- c( "I alt" = "All items (CPI)", "Matvarer og alkoholfrie drikkevarer" = "Food & non-alcoholic drinks", "Matvarer" = "Food only", "Brød og kornprodukter" = "Bread & cereals" ) df3_ridge <- df3_food_yoy |> mutate( category_en = recode(`vare- og tjenestegruppe`, !!!food_labels), year = as.factor(lubridate::year(date)) ) |> filter(lubridate::year(date) >= 2018) if (nrow(df3_ridge) == 0) { message("df3_ridge empty after year filter.") df3_ridge <- NULL } if (!is.null(df3_ridge) && nrow(df3_ridge) > 0) { pal_ridge <- met.brewer("Hokusai2", n = length(unique(df3_ridge$year)), type = "continuous") p <- ggplot(df3_ridge, aes(x = value, y = year, fill = year)) + geom_density_ridges(alpha = 0.75, scale = 1.2, bandwidth = 0.8, colour = "white", show.legend = FALSE) + scale_fill_manual(values = pal_ridge) + facet_wrap(~ category_en, ncol = 2) + geom_vline(xintercept = 0, linetype = "dashed", colour = "grey40") + labs( title = "Distribution of 12-month price changes by food category, 2018 – 2026", subtitle = "Post-2021 distributions shifted firmly above zero; bread & cereals show extreme right tail", x = "12-month change (%)", y = "Year", caption = "Source: Statistics Norway, table 14700" ) + theme_minimal(base_size = 12) + theme( panel.grid.minor = element_blank(), strip.text = element_text(face = "bold", size = 10) ) print(p) }}```---## Key findings- **Vacancy collapse in construction**: Job vacancies in the construction and civil engineering sector peaked in 2022 and have retreated to multi-year lows, signalling a sharp contraction in Norway's most cyclically sensitive labour market segment.- **Violence rising against a falling total**: While total reported crime has declined over two decades, offences categorised as violence and abuse have followed a distinctly different trajectory — edging upward even as property theft falls, pushing the violence share of all crime to its highest level on record.- **Drug offences volatile but elevated**: Drug-related offences have swung sharply with enforcement cycles but remain well above 2005 levels, reflecting both usage patterns and policing priorities.- **Food inflation structurally above CPI**: The twelve-month change for food and non-alcoholic beverages has, since 2021, almost always exceeded the headline CPI rate. Bread and cereal prices showed the most extreme rightward distribution shift — a particular burden for families with tight budgets.- **Compounding pressure on low-wage workers**: The sectors shedding vacancies fastest — construction, transport, manufacturing — are also those employing workers most exposed to food price inflation. The labour-market and cost-of-living crises are not hitting different parts of the population in isolation; they overlap almost exactly.---## Closing reflectionNorway's welfare architecture was designed to absorb shocks — strong automatic stabilisers, generous unemployment benefits, and a sovereign wealth fund that cushions fiscal policy. But architecture designed for sequential shocks is less well-suited to simultaneous ones. A hiring freeze in physical-economy sectors, a crime landscape that is shifting from property to violence, and food prices that refuse to return to pre-shock norms represent precisely the kind of multi-front stress test that turns structural resilience into structural strain.The numbers here do not spell crisis in the dramatic sense. But they do mark a departure from the comfortable Norwegian norm of the 2000s and 2010s — a period when job vacancies kept rising, crime kept falling, and inflation barely registered. That era now looks, in retrospect, like an unusually benign interval. The question for 2026 and beyond is how durably Norwegian institutions can hold the line.