Can a Portfolio of Farmed Signals Harvest a Factor Premium?
finance
quant
factor-investing
portfolio-construction
Eighty-eight cross-sectional signals and forty-five timing rules, sorted into themes and blended five ways. The blends load hard on value and momentum – and the premium they harvest is the factors’, in a sample where the factors barely paid.
Published
September 30, 2026
From a pile of signals to a portfolio
The farming pipeline judges every signal alone. A fund would not trade them alone. This page sorts the library into themes, measures how different the ideas really are, then blends them — and asks whether the blend earns a premium, and whose premium it is.
88 cross-sectional signals45 market-timing rules8 themesOct 2003–Jan 2024, monthly, net of 10bp
15
Effective bets among 88
-0.17
Sharpe, 1/N of everything
+0.47 / -0.36
Textbook / agent-invented blend
46–62%
Blend variance explained by 4 factors
The question
The main farming page asks of each signal: does this predict returns on its own? Most of the library fails that test after correcting for the size of the search, and a reasonable response is that single signals were never the point. Weak, imperfectly correlated edges are supposed to add up. That is the whole argument for multi-factor portfolios.
So this study takes the argument seriously. It asks three things:
What did the farm actually find? A map of the library by theme, data source and origin.
Do the signals diversify each other? Correlation structure and the effective number of independent bets.
Does a combination harvest a premium, and is it a factor premium? Five blends, each regressed on market, size, value and momentum factors built from the same panel.
Two rules keep the blends honest. Every signal keeps the sign its idea agent committed to before the backtest; nothing is flipped because it lost money. And the catalog keeps every idea that was implemented, regardless of how it performed, so “all live signals” is not a set chosen by outcome. Near-duplicates (|correlation| above the novelty threshold) are excluded so one bet is not counted twice. The two adaptive blends size month t using returns through month t−1 only.
1. What the farm found
The catalog’s own categories are coarse: a third of the library was filed as “other”. Sorting by what the signal actually does gives eight cross-sectional themes, plus the market-timing rules, which are a different kind of strategy altogether (a time-varying market exposure rather than a long/short stock book).
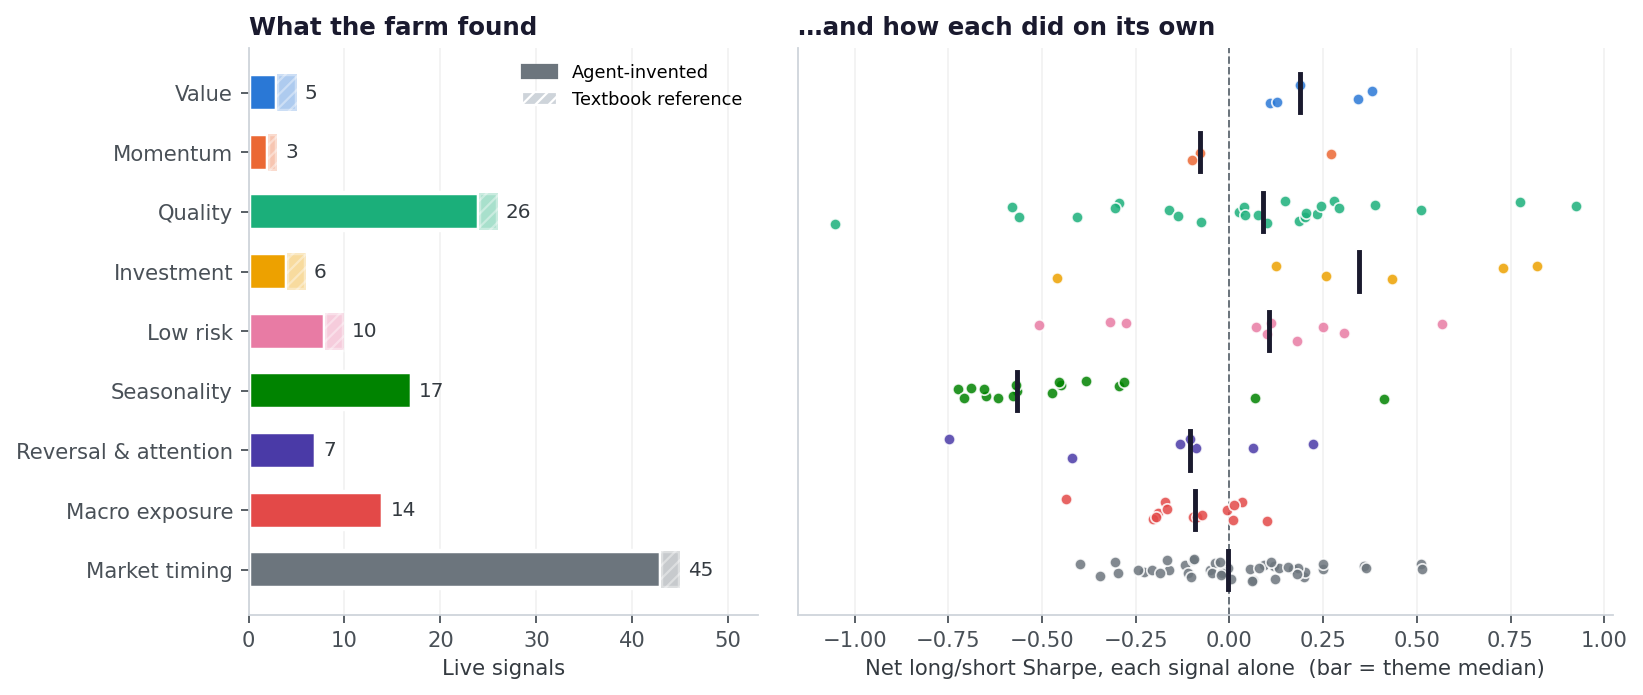
Left: live signals per theme, split into agent-invented and the textbook references the harness ships with. Right: each signal’s own net long/short Sharpe; the dark bar is the theme median.
Theme
Signals
Median Sharpe
Positive
Theme blend Sharpe
Best single signal
Data used
Value
5 (2 textbook)
+0.19
100%
+0.46
retained_vs_contributed_capital_value(+0.38)
price 60%, fundamental 60%, macro 20%
Momentum
3 (1 textbook)
-0.08
33%
+0.09
momentum_12_1(+0.27)
price 67%, macro 33%, fundamental 33%
Quality
26 (2 textbook)
+0.09
65%
+0.16
gross_profitability(+0.92)
fundamental 92%, price 38%, macro 15%
Investment
6 (2 textbook)
+0.35
83%
+0.63
payout_funding_gap(+0.82)
fundamental 67%, price 33%, macro 17%
Low risk
10 (2 textbook)
+0.11
70%
+0.14
macro_systematic_variance_share(+0.57)
price 90%, macro 90%, fundamental 30%
Seasonality
17
-0.57
12%
-0.76
predicted_dividend_month_premium(+0.41)
price 100%, fundamental 18%
Reversal & attention
7
-0.10
29%
-0.23
quiet_strength_low_attention_high(+0.22)
price 100%, macro 43%
Macro exposure
14
-0.09
29%
-0.28
oil_beta_trend_interaction(+0.10)
macro 100%, price 93%, fundamental 50%
Market timing
45 (2 textbook)
-0.01
49%
+0.16
stagflation_supply_shock_timing(+0.52)
macro 73%, price 49%, fundamental 22%
The shape of the library says something about how the idea agent searches. It went deepest where the accounting data is richest: 26 quality and earnings-quality ideas, nearly all built on fundamentals. The second-largest cluster is calendar seasonality (17 ideas), built mostly from price data, and it is the worst-performing theme in the library. Only 12% of those signals have a positive Sharpe, and their 1/N blend runs at -0.76. Many are variations on published calendar anomalies (same-month return persistence, tax-loss selling around the turn of the year), and on this universe and period, net of costs, they lost steadily. Reversing their signs now would be exactly the after-the-fact decision the study refuses to make.
Value and investment are the only themes where a clear majority of ideas work. They are also small and close to the textbook: 4 of their 11 signals are the reference anomalies the harness ships with.
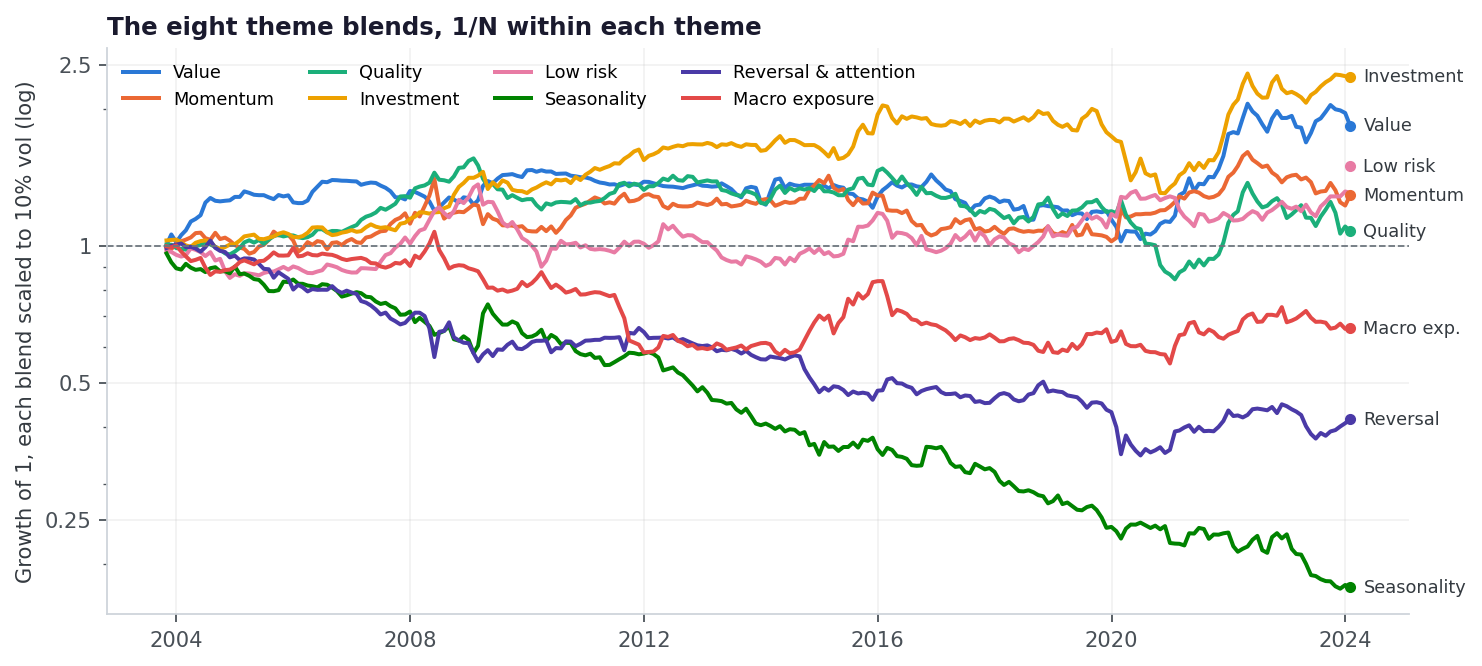
Each theme blended 1/N and scaled to 10% volatility, so the shapes compare. Two themes are steady losses rather than noise.
2. How different are they?
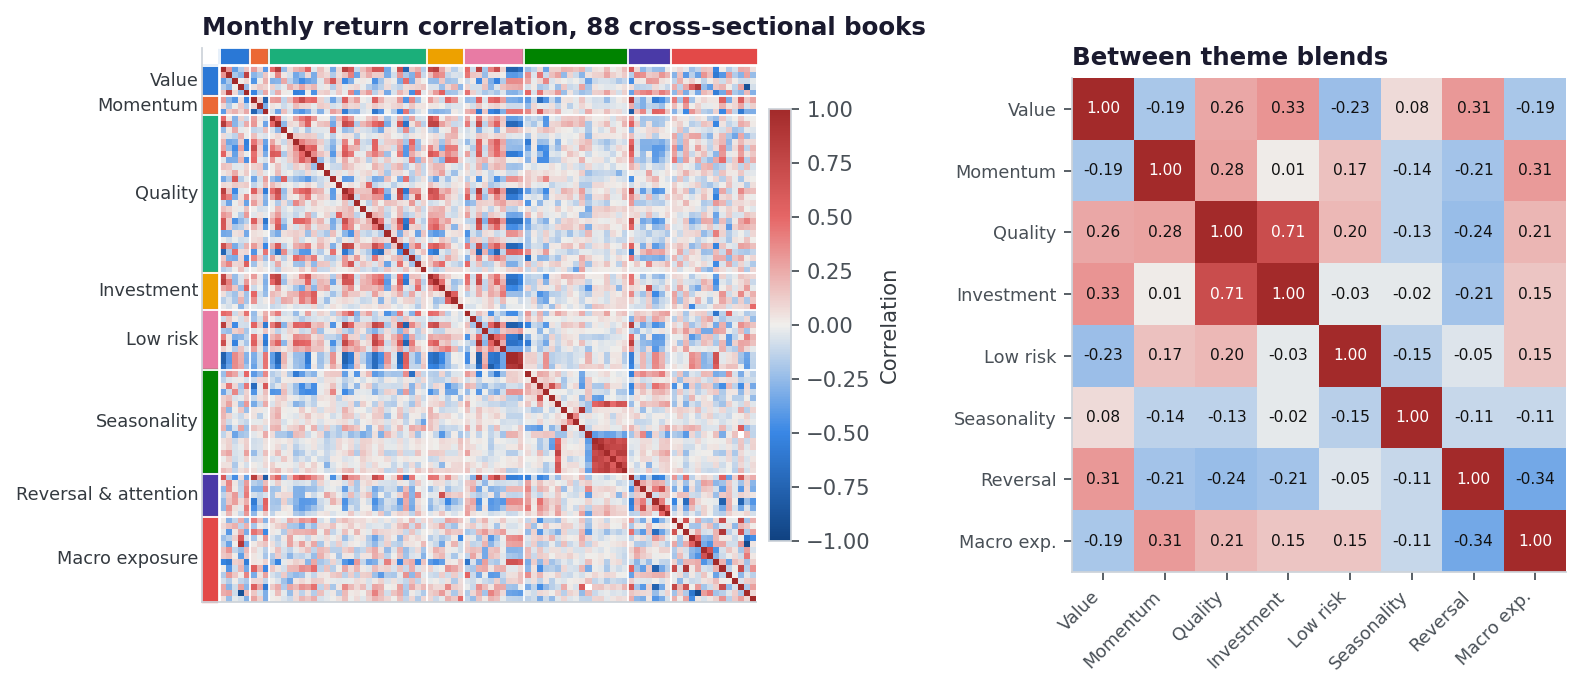
Left: pairwise correlation of the monthly long/short returns, grouped by theme (edge bands). Right: correlation between the eight theme blends.
The library is genuinely diverse. The average absolute correlation between two signals’ returns is 0.17. Themes are weak clusters: two signals from the same theme correlate +0.054 on average, barely more than two from different themes (+0.004). The eigenvalues of the correlation matrix put the library at about 15 effective independent bets out of 88. That is plenty of room to diversify.
The exception is on the right: the quality and investment blends correlate 0.71. Low accruals, conservative payouts and restrained asset growth describe the same kind of company, and the returns agree.
3. Diversification converges — to the average
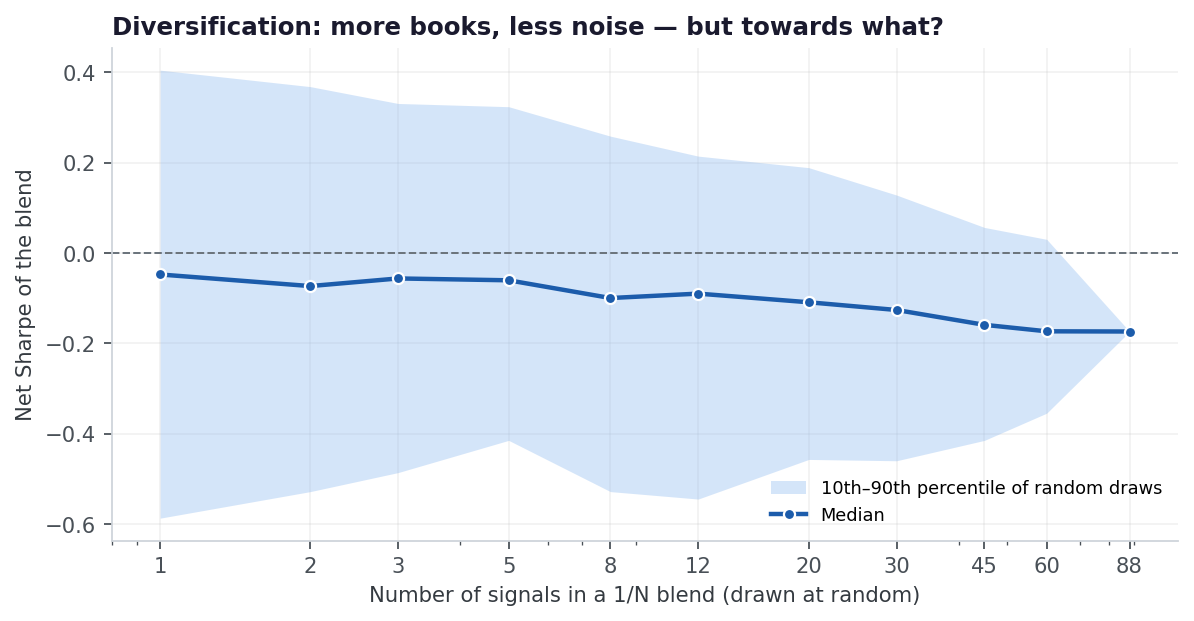
Sharpe of a 1/N blend of k signals drawn at random, 300 draws per size. The band narrows as k grows: diversification removes noise.
This chart is the key to everything that follows. Blending does exactly what it promises: the spread of outcomes collapses, from a 10th–90th percentile range of -0.59 to 0.40 for one signal to a single number for all 88, and volatility falls from 12.3% to 2.3% a year. But diversification removes noise. It does not add edge. It converges on the average signal, and in this library the average signal loses money after costs. The median line slopes gently down: the more signals you blend, the more certainly you get the library’s mean, which is -0.17 Sharpe.
4. Five ways to combine
Blend
Sharpe
Ann. return
Ann. vol
Max drawdown
Sharpe pre / post 2012
Equal weight 1/N across every cross-sectional book
-0.17
-0.4%
2.3%
-18.2%
-0.34 / -0.13
Theme parity 1/N across the eight theme blends, so 26 quality ideas count once
0.05
0.1%
2.4%
-13.5%
0.08 / 0.04
Inverse vol each book weighted by 1 / trailing 36-month volatility
-0.31
-0.6%
1.7%
-19.5%
0.18 / -0.51
Trailing winners 1/N across books with a positive trailing 60-month mean; cash if none
0.22
0.9%
4.6%
-14.9%
0.27 / 0.19
Integrated score one decile book on the average cross-sectional rank of every signal
0.36
4.0%
13.3%
-45.7%
0.57 / 0.31
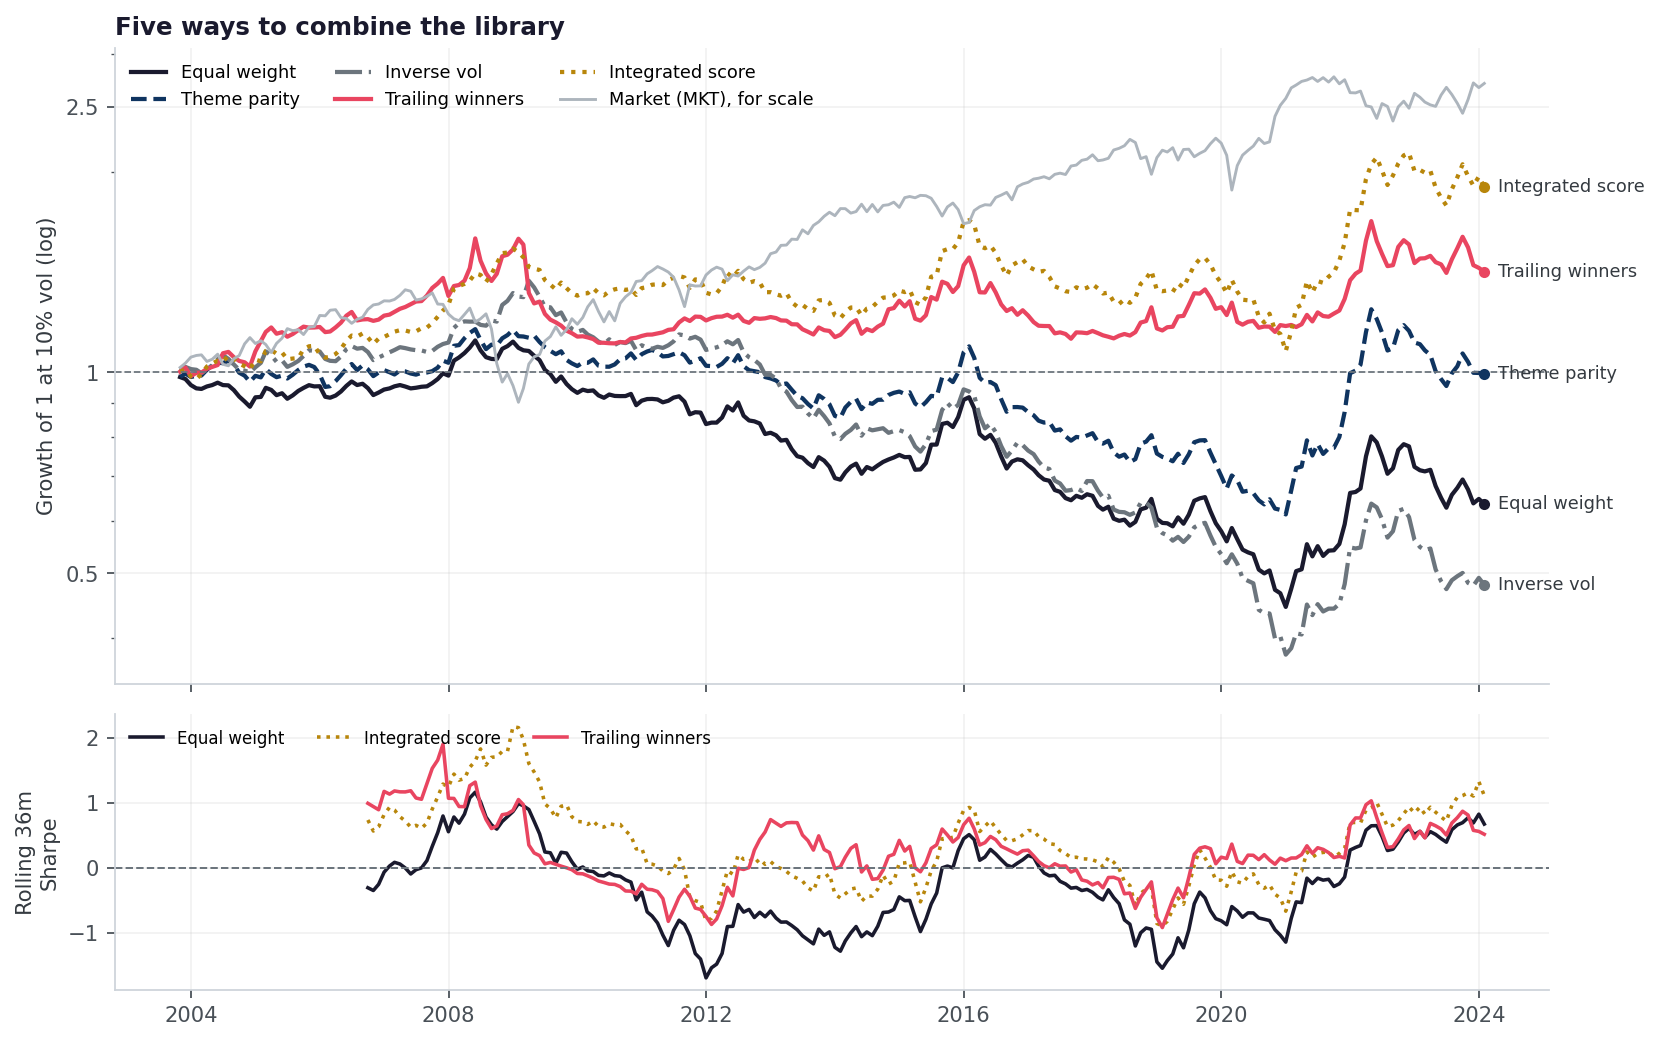
Top: each blend scaled to 10% annual volatility so the shapes compare, with the market for scale. Bottom: rolling three-year Sharpe.
Equal weight lands at -0.17, as the diversification curve predicted.
Theme parity caps each theme at one-eighth of the book, so the 26 quality ideas no longer outvote the 5 value ideas. That lifts Sharpe to +0.05, which is still zero for practical purposes.
Inverse vol is the worst of the five (-0.31). The lowest-volatility books in this library are disproportionately the losing ones (the calmest third has a median Sharpe of -0.22, the most volatile third +0.01), so risk parity scales the losers up.
Trailing winners holds only books whose trailing five-year mean is positive (a median of 39 of 88 at any time). It recovers +0.22. That is consistent with factor momentum, but it is not distinguishable from zero (t = 0.99).
Integrated score is the only blend that clears the others comfortably, at +0.36. It is also a different animal. Averaging ranks before trading lets opposing views on a stock cancel out, so the book concentrates on names most signals agree on. It runs at 13.3% volatility against 2.3% for the return blend, with a -45.7% maximum drawdown and one-way turnover of 1.22 a month (the median single signal turns over 0.59).
4 of the 5 blends are weaker after 2012 than before, in line with the evidence that anomalies decay once published. The exception is equal weight, which loses less in the second half, though losing less is not the same as working.
5. Whose premium is it?
A blend that earns something might be harvesting new return, or it might be a roundabout way to own the factors everyone already knows. Regressing each blend on market, size, value and momentum separates the two.
Blend
β MKT (t)
β SMB (t)
β HML (t)
β UMD (t)
Alpha / yr
Alpha t
R²
Equal weight
-0.02 (-3.2)
-0.10 (-8.1)
+0.16 (7.5)
+0.11 (5.5)
-0.7%
-1.75
56%
Theme parity
-0.02 (-2.4)
-0.11 (-7.0)
+0.19 (6.8)
+0.10 (5.4)
-0.2%
-0.49
53%
Inverse vol
-0.02 (-3.4)
-0.07 (-7.1)
+0.13 (8.0)
+0.06 (3.4)
-0.7%
-2.07
46%
Trailing winners
-0.02 (-1.5)
-0.19 (-5.7)
+0.17 (4.7)
+0.25 (9.1)
+0.4%
0.57
62%
Integrated score
-0.21 (-6.9)
-0.50 (-6.7)
+0.95 (8.7)
+0.59 (8.0)
+4.6%
2.36
60%
How to read this. Betas are loadings on the factor long/short portfolios (t-stats in brackets, Newey-West). Alpha is the return the four factors do not explain; it is the part of the premium that is actually the library’s own.
The loadings are the clearest result on the page. Every blend is long value, long momentum and short small caps, with t-stats between 3 and 9, and the four factors explain 46–62% of every blend’s variance. Individually the signals looked diverse. In aggregate the library leans the way the academic literature leans, because that is where the idea agent most plausibly learned what a good signal looks like.
So the blends do harvest factor premia, in the sense that they load on them. The problem is what those premia paid over this window:
Factor
Ann. return
Sharpe
t-stat (NW)
MKTMarket (equal-weighted universe)
9.0%
0.54
2.45
SMBSize: small minus big
-2.4%
-0.20
-0.96
HMLValue: low minus high price/book
0.1%
0.06
0.24
UMDMomentum: winners minus losers
0.9%
0.13
0.59
Over Oct 2003–Jan 2024, value was flat, momentum barely positive and size negative; only the market paid. A portfolio that loads on HML and UMD collects roughly nothing from those loadings. That is why the return blends have alphas near zero or below: equal weight -0.7% a year (t = -1.75), inverse vol t = -2.07.
The integrated book is the exception, with alpha of +4.6% a year (t = 2.36). Look at its betas, though: an HML loading of 0.95 and a UMD loading of 0.59, several times the return blends’. Integrating scores turned a mild, diluted factor tilt into a concentrated one. The alpha clears t = 2 only narrowly, and it is the best of five combinations tried, before any correction for having tried five.
By theme: which ideas are factors in disguise?
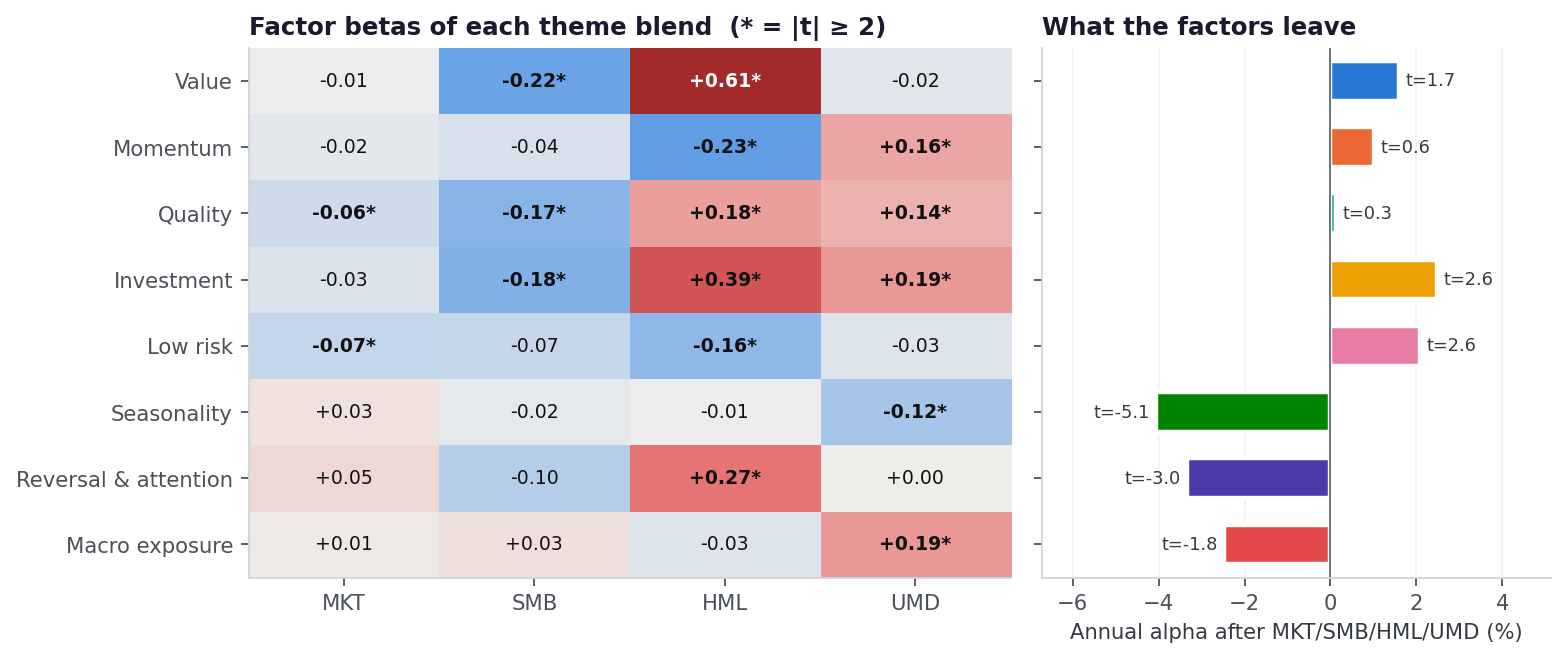
Left: factor betas of each theme blend (* marks |t| ≥ 2). Right: the annual alpha the four factors leave unexplained.
The themes load where their names say they should. The value blend is a value tilt (HML +0.61); quality and investment are value plus momentum; low risk is short value, and the macro-exposure blend loads on momentum. After the factors, investment and low risk keep a significant positive alpha (t ≥ 2), and seasonality and reversal & attention carry a significant negative one. The negative alphas are not a factor story: seasonality and reversal barely load on anything (R² 15% and 20%). They are losses of their own.
Across single signals, 9 of 88 have a factor-adjusted alpha with t ≥ 2 and 20 have t ≤ −2. A search with no skill would put about two in each tail.
Textbook versus invented
1/N blend of
Signals
Sharpe
Alpha / yr
Alpha t
R²
Textbook references
9
0.47
+2.6%
2.98
70%
Agent-invented
79
-0.36
-1.0%
-2.50
42%
Split the library by who wrote the signal and the picture sharpens. The 9 textbook references, blended 1/N, earn Sharpe 0.47 with a factor-adjusted alpha t-stat of 2.98. The 79 agent-invented signals, blended the same way, earn -0.36 with alpha t = -2.50: significantly negative after the factors. As a portfolio, the farm’s inventions subtract value. The positive premium in the library comes from the ideas it was seeded with.
Do the blends add anything to the factors?
The formal version of the question is spanning: if you can already hold the four factors, does adding a blend raise the best achievable Sharpe?
Investable set
Max Sharpe (in-sample)
Gain over factors
The four factors alone
0.93
+0.00
Factors + equal weight
1.02
+0.10
Factors + theme parity
0.93
+0.01
Factors + inverse vol
1.08
+0.15
Factors + trailing winners
0.94
+0.01
Factors + integrated score
1.07
+0.15
Factors + all eight theme blends
1.81
+0.89
The best single blend adds +0.15 to the factors’ 0.93. Adding all eight theme blends at once reaches 1.81, but that number should not be trusted. It comes from an in-sample optimiser choosing twelve weights with hindsight, free to short the seasonality theme it now knows lost money. That is the sign flip the rest of the page refuses, done by an optimiser instead of by hand.
6. The timing sleeve
The 45 market-timing rules are a separate kind of strategy, so they stay out of the blends above. Blended 1/N they earn Sharpe 0.06 at 1.7% volatility. The factors explain only 7% of that, with a market beta of +0.03 and alpha t = -0.56. They are uncorrelated with the factors, which is useful in principle, but there is no premium to harvest.
What this adds up to
Combining signals works exactly as advertised on risk and not at all on return. The farmed library is diverse enough to diversify, about 15 independent bets, and blending it produces smooth, low-volatility return streams. But a blend converges on the average signal, and the average farmed signal does not earn its trading costs. What the blends do reliably hold is the classic factors: long value, long momentum, short size, and that accounts for 46–62% of their variance. That is a factor premium the combination genuinely harvests, and over Oct 2003–Jan 2024 it was worth very little.
The best result on the page, the integrated score book, is the one that concentrates those factor bets most. It earns a marginal alpha, and it wins a five-way comparison in which it was the most aggressive entrant.
What this does not show. The common window starts in October 2003 because the adaptive blends need history to estimate from; single-signal results on the main page use the full sample. The factors are equal-weighted tercile spreads built from this panel, not the Fama-French series, so they share this universe’s liquidity filter and exclude the smallest stocks. Costs are a flat 10bp on traded notional. The integrated book and the seasonality signals trade the most, so a realistic cost model would hurt them the most. And the theme labels are a keyword mapping written for this page; a different taxonomy would move the theme-level numbers, though not the library-wide blends.
The blending rules live in src/llm_alpha/backtest/combination.py, where each adaptive rule has a test that shocks one month and checks that no earlier month moves.
Source Code
---title: "Can a Portfolio of Farmed Signals Harvest a Factor Premium?"description: "Eighty-eight cross-sectional signals and forty-five timing rules, sorted into themes and blended five ways. The blends load hard on value and momentum -- and the premium they harvest is the factors', in a sample where the factors barely paid."date: 2026-09-30date-format: longcategories: [finance, quant, factor-investing, portfolio-construction]execute: echo: false freeze: falseformat: html: page-layout: full toc: true toc-depth: 2---<style>.sc-hero{background:linear-gradient(135deg,#1a1a2e0%,#0f3460100%);color:#fff;border-radius:14px;padding:2.5rem2rem;margin:002rem}.sc-hero h2{color:#fff;margin:00.4rem;font-size:1.9rem;border:0}.sc-hero.sc-sub{opacity:.85;font-weight:300;font-size:1.05rem;margin-bottom:1.25rem}.sc-hero.sc-chip{background:rgba(255,255,255,.14);border:1pxsolidrgba(255,255,255,.28);padding:.32rem.85rem;border-radius:2rem;font-size:.8rem;font-weight:500;display:inline-block;margin:.2rem.3rem.2rem0}.sc-metrics{display:grid;grid-template-columns:repeat(auto-fit,minmax(170px,1fr));gap:1rem;margin:1.5rem02rem}.sc-metric{background:#fff;border:1pxsolid#e9ecef;border-radius:10px;padding:1.15rem;text-align:center}.sc-metric.v{font-size:1.7rem;font-weight:700;color:#1a1a2e;line-height:1.15}.sc-metric.l{font-size:.72rem;color:#6c757d;text-transform:uppercase;letter-spacing:.05em;margin-top:.3rem}.sc-table{width:100%;border-collapse:collapse;font-size:.87rem;margin:1rem0}.sc-table th{background:#f8f9fa;color:#1a1a2e;text-align:left;padding:.6rem.7rem;border-bottom:2pxsolid#dee2e6;font-size:.78rem;text-transform:uppercase;letter-spacing:.04em}.sc-table td{padding:.55rem.7rem;border-bottom:1pxsolid#f1f3f5;vertical-align:top}.sc-table tr:hover td{background:#fbfcfd}.sc-table.num{text-align:right;font-family:'JetBrains Mono',monospace;font-size:.84rem;white-space:nowrap}.sc-table.small{font-size:.78rem;color:#6c757d}.sc-swatch{display:inline-block;width:.75rem;height:.75rem;border-radius:3px;margin-right:.45rem;vertical-align:-.05rem}.sc-pos{color:#198754;font-weight:600}.sc-neg{color:#b02a37;font-weight:600}.sc-note{background:#f8f9fa;border-left:4pxsolid#0f3460;border-radius:8px;padding:1rem1.15rem;margin:1.4rem0;font-size:.9rem}.sc-note strong{color:#0f3460}.sc-warn{background:#fff8f0;border-left:4pxsolid#b8860b;border-radius:8px;padding:1rem1.15rem;margin:1.4rem0;font-size:.9rem}.sc-warn strong{color:#b8860b}</style><div class="sc-hero"><h2>From a pile of signals to a portfolio</h2><div class="sc-sub">The farming pipeline judges every signal alone. A fund would not trade them alone.This page sorts the library into themes, measures how different the ideas really are, then blendsthem — and asks whether the blend earns a premium, and whose premium it is.</div><span class="sc-chip">88 cross-sectional signals</span><span class="sc-chip">45 market-timing rules</span><span class="sc-chip">8 themes</span><span class="sc-chip">Oct 2003–Jan 2024, monthly, net of 10bp</span></div><div class="sc-metrics"><div class="sc-metric"><div class="v">15</div><div class="l">Effective bets among 88</div></div><div class="sc-metric"><div class="v">-0.17</div><div class="l">Sharpe, 1/N of everything</div></div><div class="sc-metric"><div class="v">+0.47 / -0.36</div><div class="l">Textbook / agent-invented blend</div></div><div class="sc-metric"><div class="v">46–62%</div><div class="l">Blend variance explained by 4 factors</div></div></div>## The questionThe [main farming page](../llm-alpha/index.qmd) asks of each signal: *does this predict returns onits own?* Most of the library fails that test after correcting for the size of the search, and areasonable response is that single signals were never the point. Weak, imperfectly correlatededges are supposed to add up. That is the whole argument for multi-factor portfolios.So this study takes the argument seriously. It asks three things:1. **What did the farm actually find?** A map of the library by theme, data source and origin.2. **Do the signals diversify each other?** Correlation structure and the effective number of independent bets.3. **Does a combination harvest a premium, and is it a *factor* premium?** Five blends, each regressed on market, size, value and momentum factors built from the same panel.<div class="sc-note"><strong>Two rules keep the blends honest.</strong> Every signal keeps the sign its idea agentcommitted to <em>before</em> the backtest; nothing is flipped because it lost money. And thecatalog keeps every idea that was implemented, regardless of how it performed, so "all livesignals" is not a set chosen by outcome. Near-duplicates (|correlation| above the noveltythreshold) are excluded so one bet is not counted twice. The two adaptive blends size month<em>t</em> using returns through month <em>t</em>−1 only.</div>## 1. What the farm foundThe catalog's own categories are coarse: a third of the library was filed as "other". Sorting bywhat the signal actually does gives eight cross-sectional themes, plus the market-timing rules,which are a different kind of strategy altogether (a time-varying market exposure rather than along/short stock book).{fig-alt="Bar chart of signal counts by theme and strip plot of each signal's Sharpe by theme"}<table class="sc-table"><thead><tr><th>Theme</th><th class="num">Signals</th><th class="num">Median Sharpe</th><th class="num">Positive</th><th class="num">Theme blend Sharpe</th><th>Best single signal</th><th>Data used</th></tr></thead><tbody><tr><td><span class="sc-swatch" style="background:#2a78d6"></span><strong>Value</strong></td><td class="num">5<span class="small"> (2 textbook)</span></td><td class="num"><span class="sc-pos">+0.19</span></td><td class="num">100%</td><td class="num"><span class="sc-pos">+0.46</span></td><td><code>retained_vs_contributed_capital_value</code> <span class="small">(+0.38)</span></td><td class="small">price 60%, fundamental 60%, macro 20%</td></tr><tr><td><span class="sc-swatch" style="background:#eb6834"></span><strong>Momentum</strong></td><td class="num">3<span class="small"> (1 textbook)</span></td><td class="num"><span class="sc-neg">-0.08</span></td><td class="num">33%</td><td class="num"><span class="sc-pos">+0.09</span></td><td><code>momentum_12_1</code> <span class="small">(+0.27)</span></td><td class="small">price 67%, macro 33%, fundamental 33%</td></tr><tr><td><span class="sc-swatch" style="background:#1baf7a"></span><strong>Quality</strong></td><td class="num">26<span class="small"> (2 textbook)</span></td><td class="num"><span class="sc-pos">+0.09</span></td><td class="num">65%</td><td class="num"><span class="sc-pos">+0.16</span></td><td><code>gross_profitability</code> <span class="small">(+0.92)</span></td><td class="small">fundamental 92%, price 38%, macro 15%</td></tr><tr><td><span class="sc-swatch" style="background:#eda100"></span><strong>Investment</strong></td><td class="num">6<span class="small"> (2 textbook)</span></td><td class="num"><span class="sc-pos">+0.35</span></td><td class="num">83%</td><td class="num"><span class="sc-pos">+0.63</span></td><td><code>payout_funding_gap</code> <span class="small">(+0.82)</span></td><td class="small">fundamental 67%, price 33%, macro 17%</td></tr><tr><td><span class="sc-swatch" style="background:#e87ba4"></span><strong>Low risk</strong></td><td class="num">10<span class="small"> (2 textbook)</span></td><td class="num"><span class="sc-pos">+0.11</span></td><td class="num">70%</td><td class="num"><span class="sc-pos">+0.14</span></td><td><code>macro_systematic_variance_share</code> <span class="small">(+0.57)</span></td><td class="small">price 90%, macro 90%, fundamental 30%</td></tr><tr><td><span class="sc-swatch" style="background:#008300"></span><strong>Seasonality</strong></td><td class="num">17<span class="small"></span></td><td class="num"><span class="sc-neg">-0.57</span></td><td class="num">12%</td><td class="num"><span class="sc-neg">-0.76</span></td><td><code>predicted_dividend_month_premium</code> <span class="small">(+0.41)</span></td><td class="small">price 100%, fundamental 18%</td></tr><tr><td><span class="sc-swatch" style="background:#4a3aa7"></span><strong>Reversal & attention</strong></td><td class="num">7<span class="small"></span></td><td class="num"><span class="sc-neg">-0.10</span></td><td class="num">29%</td><td class="num"><span class="sc-neg">-0.23</span></td><td><code>quiet_strength_low_attention_high</code> <span class="small">(+0.22)</span></td><td class="small">price 100%, macro 43%</td></tr><tr><td><span class="sc-swatch" style="background:#e34948"></span><strong>Macro exposure</strong></td><td class="num">14<span class="small"></span></td><td class="num"><span class="sc-neg">-0.09</span></td><td class="num">29%</td><td class="num"><span class="sc-neg">-0.28</span></td><td><code>oil_beta_trend_interaction</code> <span class="small">(+0.10)</span></td><td class="small">macro 100%, price 93%, fundamental 50%</td></tr><tr><td><span class="sc-swatch" style="background:#6c757d"></span><strong>Market timing</strong></td><td class="num">45<span class="small"> (2 textbook)</span></td><td class="num"><span class="sc-neg">-0.01</span></td><td class="num">49%</td><td class="num"><span class="sc-pos">+0.16</span></td><td><code>stagflation_supply_shock_timing</code> <span class="small">(+0.52)</span></td><td class="small">macro 73%, price 49%, fundamental 22%</td></tr></tbody></table>The shape of the library says something about how the idea agent searches. It went deepest wherethe accounting data is richest: 26 quality and earnings-quality ideas,nearly all built on fundamentals. The second-largest cluster is calendar seasonality(17 ideas), built mostly from price data, and it is theworst-performing theme in the library. Only 12%of those signals have a positive Sharpe, and their 1/N blend runs at-0.76. Many are variations on publishedcalendar anomalies (same-month return persistence, tax-loss selling around the turn of the year),and on this universe and period, net of costs, they lost steadily. Reversing their signs now would beexactly the after-the-fact decision the study refuses to make.Value and investment are the only themes where a clear majority of ideas work. They are also smalland close to the textbook: 4 of their 11 signals are the reference anomalies the harnessships with.{fig-alt="Equity curves of the eight theme blends"}## 2. How different are they?{fig-alt="Correlation heatmap of signal returns grouped by theme, and of theme blends"}The library is genuinely diverse. The average absolute correlation between two signals' returnsis 0.17. Themes are weak clusters: two signals from the *same* theme correlate+0.054 on average, barely more than two from different themes (+0.004).The eigenvalues of the correlation matrix put the library at about **15 effectiveindependent bets** out of 88. That is plenty of room to diversify.The exception is on the right: the quality and investment blends correlate0.71. Low accruals, conservative payouts and restrainedasset growth describe the same kind of company, and the returns agree.## 3. Diversification converges — to the average{fig-alt="Median and 10th-90th percentile Sharpe of random 1/N blends by number of signals"}This chart is the key to everything that follows. Blending does exactly what it promises: thespread of outcomes collapses, from a 10th–90th percentile range of -0.59 to0.40 for one signal to a single number for all 88, and volatility fallsfrom 12.3% to 2.3% a year. But diversification removes*noise*. It does not add *edge*. It converges on the average signal, and in this library the averagesignal loses money after costs. The median line slopes gently **down**: the more signals you blend,the more certainly you get the library's mean, which is -0.17 Sharpe.## 4. Five ways to combine<table class="sc-table"><thead><tr><th>Blend</th><th class="num">Sharpe</th><th class="num">Ann. return</th><th class="num">Ann. vol</th><th class="num">Max drawdown</th><th class="num">Sharpe pre / post 2012</th></tr></thead><tbody><tr><td><strong>Equal weight</strong><br><span class='small'>1/N across every cross-sectional book</span></td><td class="num">-0.17</td><td class="num">-0.4%</td><td class="num">2.3%</td><td class="num">-18.2%</td><td class="num">-0.34 / -0.13</td></tr><tr><td><strong>Theme parity</strong><br><span class='small'>1/N across the eight theme blends, so 26 quality ideas count once</span></td><td class="num">0.05</td><td class="num">0.1%</td><td class="num">2.4%</td><td class="num">-13.5%</td><td class="num">0.08 / 0.04</td></tr><tr><td><strong>Inverse vol</strong><br><span class='small'>each book weighted by 1 / trailing 36-month volatility</span></td><td class="num">-0.31</td><td class="num">-0.6%</td><td class="num">1.7%</td><td class="num">-19.5%</td><td class="num">0.18 / -0.51</td></tr><tr><td><strong>Trailing winners</strong><br><span class='small'>1/N across books with a positive trailing 60-month mean; cash if none</span></td><td class="num">0.22</td><td class="num">0.9%</td><td class="num">4.6%</td><td class="num">-14.9%</td><td class="num">0.27 / 0.19</td></tr><tr><td><strong>Integrated score</strong><br><span class='small'>one decile book on the average cross-sectional rank of every signal</span></td><td class="num">0.36</td><td class="num">4.0%</td><td class="num">13.3%</td><td class="num">-45.7%</td><td class="num">0.57 / 0.31</td></tr></tbody></table>{fig-alt="Equity curves and rolling Sharpe of five signal-combination methods"}- **Equal weight** lands at -0.17, as the diversification curve predicted.- **Theme parity** caps each theme at one-eighth of the book, so the 26 quality ideas no longer outvote the 5 value ideas. That lifts Sharpe to +0.05, which is still zero for practical purposes.- **Inverse vol** is the worst of the five (-0.31). The lowest-volatility books in this library are disproportionately the losing ones (the calmest third has a median Sharpe of -0.22, the most volatile third +0.01), so risk parity scales the losers *up*.- **Trailing winners** holds only books whose trailing five-year mean is positive (a median of 39 of 88 at any time). It recovers +0.22. That is consistent with factor momentum, but it is not distinguishable from zero (t = 0.99).- **Integrated score** is the only blend that clears the others comfortably, at +0.36. It is also a different animal. Averaging ranks *before* trading lets opposing views on a stock cancel out, so the book concentrates on names most signals agree on. It runs at 13.3% volatility against 2.3% for the return blend, with a -45.7% maximum drawdown and one-way turnover of 1.22 a month (the median single signal turns over 0.59).4 of the 5 blends are weaker after 2012 than before, in line with the evidence that anomalies decay once published. The exception is equal weight, which loses less in the second half, though losing less is not the same as working.## 5. Whose premium is it?A blend that earns something might be harvesting new return, or it might be a roundabout way toown the factors everyone already knows. Regressing each blend on market, size, value and momentumseparates the two.<table class="sc-table"><thead><tr><th>Blend</th><th class="num">β MKT (t)</th><th class="num">β SMB (t)</th><th class="num">β HML (t)</th><th class="num">β UMD (t)</th><th class="num">Alpha / yr</th><th class="num">Alpha t</th><th class="num">R²</th></tr></thead><tbody><tr><td><strong>Equal weight</strong></td><td class="num">-0.02<span class="small"> (-3.2)</span></td><td class="num">-0.10<span class="small"> (-8.1)</span></td><td class="num">+0.16<span class="small"> (7.5)</span></td><td class="num">+0.11<span class="small"> (5.5)</span></td><td class="num"><span class="sc-neg">-0.7%</span></td><td class="num"><strong>-1.75</strong></td><td class="num">56%</td></tr><tr><td><strong>Theme parity</strong></td><td class="num">-0.02<span class="small"> (-2.4)</span></td><td class="num">-0.11<span class="small"> (-7.0)</span></td><td class="num">+0.19<span class="small"> (6.8)</span></td><td class="num">+0.10<span class="small"> (5.4)</span></td><td class="num"><span class="sc-neg">-0.2%</span></td><td class="num"><strong>-0.49</strong></td><td class="num">53%</td></tr><tr><td><strong>Inverse vol</strong></td><td class="num">-0.02<span class="small"> (-3.4)</span></td><td class="num">-0.07<span class="small"> (-7.1)</span></td><td class="num">+0.13<span class="small"> (8.0)</span></td><td class="num">+0.06<span class="small"> (3.4)</span></td><td class="num"><span class="sc-neg">-0.7%</span></td><td class="num"><strong>-2.07</strong></td><td class="num">46%</td></tr><tr><td><strong>Trailing winners</strong></td><td class="num">-0.02<span class="small"> (-1.5)</span></td><td class="num">-0.19<span class="small"> (-5.7)</span></td><td class="num">+0.17<span class="small"> (4.7)</span></td><td class="num">+0.25<span class="small"> (9.1)</span></td><td class="num"><span class="sc-pos">+0.4%</span></td><td class="num"><strong>0.57</strong></td><td class="num">62%</td></tr><tr><td><strong>Integrated score</strong></td><td class="num">-0.21<span class="small"> (-6.9)</span></td><td class="num">-0.50<span class="small"> (-6.7)</span></td><td class="num">+0.95<span class="small"> (8.7)</span></td><td class="num">+0.59<span class="small"> (8.0)</span></td><td class="num"><span class="sc-pos">+4.6%</span></td><td class="num"><strong>2.36</strong></td><td class="num">60%</td></tr></tbody></table><div class="sc-note"><strong>How to read this.</strong> Betas are loadings on the factor long/short portfolios (t-statsin brackets, Newey-West). Alpha is the return the four factors do not explain; it is the part ofthe premium that is actually the library's own.</div>The loadings are the clearest result on the page. **Every blend is long value, long momentum andshort small caps**, with t-stats between 3 and 9, and the four factors explain46–62% of every blend's variance. Individually the signals lookeddiverse. In aggregate the library leans the way the academic literature leans, because that iswhere the idea agent most plausibly learned what a good signal looks like.So the blends do harvest factor premia, in the sense that they load on them. The problem is whatthose premia paid over this window:<table class="sc-table"><thead><tr><th>Factor</th><th class="num">Ann. return</th><th class="num">Sharpe</th><th class="num">t-stat (NW)</th></tr></thead><tbody><tr><td><strong>MKT</strong> <span class='small'>Market (equal-weighted universe)</span></td><td class="num">9.0%</td><td class="num">0.54</td><td class="num">2.45</td></tr><tr><td><strong>SMB</strong> <span class='small'>Size: small minus big</span></td><td class="num">-2.4%</td><td class="num">-0.20</td><td class="num">-0.96</td></tr><tr><td><strong>HML</strong> <span class='small'>Value: low minus high price/book</span></td><td class="num">0.1%</td><td class="num">0.06</td><td class="num">0.24</td></tr><tr><td><strong>UMD</strong> <span class='small'>Momentum: winners minus losers</span></td><td class="num">0.9%</td><td class="num">0.13</td><td class="num">0.59</td></tr></tbody></table>Over Oct 2003–Jan 2024, value was flat, momentum barely positive and size negative; only the market paid.A portfolio that loads on HML and UMD collects roughly nothing from those loadings. That is why thereturn blends havealphas near zero or below: equal weight -0.7% a year(t = -1.75), inverse vol t = -2.07.The integrated book is the exception, with alpha of +4.6% a year(t = 2.36). Look at its betas, though: an HML loading of0.95 and a UMD loading of 0.59, several times the returnblends'. Integrating scores turned a mild, diluted factor tilt into a concentrated one. The alphaclears t = 2 only narrowly, and it is the best of five combinations tried, before any correctionfor having tried five.### By theme: which ideas are factors in disguise?{fig-alt="Heatmap of factor betas per theme and bar chart of theme alphas"}The themes load where their names say they should. The value blend is a value tilt (HML+0.61); quality and investment are value plus momentum;low risk is <em>short</em> value, and themacro-exposure blend loads on momentum. After the factors,investment and low risk keep asignificant positive alpha (t ≥ 2), and seasonality and reversal & attentioncarry a significant *negative* one. The negativealphas are not a factor story: seasonality and reversal barely load on anything (R²15% and 20%). Theyare losses of their own.Across single signals, 9 of 88 have a factor-adjusted alpha with t ≥ 2and 20 have t ≤−2. A search with no skill would put about two in each tail.### Textbook versus invented<table class="sc-table"><thead><tr><th>1/N blend of</th><th class="num">Signals</th><th class="num">Sharpe</th><th class="num">Alpha / yr</th><th class="num">Alpha t</th><th class="num">R²</th></tr></thead><tbody><tr><td><strong>Textbook references</strong></td><td class='num'>9</td><td class='num'>0.47</td><td class="num"><span class="sc-pos">+2.6%</span></td><td class='num'>2.98</td><td class='num'>70%</td></tr><tr><td><strong>Agent-invented</strong></td><td class='num'>79</td><td class='num'>-0.36</td><td class="num"><span class="sc-neg">-1.0%</span></td><td class='num'>-2.50</td><td class='num'>42%</td></tr></tbody></table>Split the library by who wrote the signal and the picture sharpens. The 9 textbookreferences, blended 1/N, earn Sharpe 0.47 with a factor-adjusted alphat-stat of 2.98. The 79 agent-invented signals, blended the sameway, earn -0.36 with alpha t = -2.50: significantly*negative* after the factors. As a portfolio, the farm's inventions subtract value. The positivepremium in the library comes from the ideas it was seeded with.### Do the blends add anything to the factors?The formal version of the question is spanning: if you can already hold the four factors, doesadding a blend raise the best achievable Sharpe?<table class="sc-table"><thead><tr><th>Investable set</th><th class="num">Max Sharpe (in-sample)</th><th class="num">Gain over factors</th></tr></thead><tbody><tr><td>The four factors alone</td><td class='num'>0.93</td><td class="num"><span class="">+0.00</span></td></tr><tr><td>Factors + equal weight</td><td class='num'>1.02</td><td class="num"><span class="sc-pos">+0.10</span></td></tr><tr><td>Factors + theme parity</td><td class='num'>0.93</td><td class="num"><span class="sc-pos">+0.01</span></td></tr><tr><td>Factors + inverse vol</td><td class='num'>1.08</td><td class="num"><span class="sc-pos">+0.15</span></td></tr><tr><td>Factors + trailing winners</td><td class='num'>0.94</td><td class="num"><span class="sc-pos">+0.01</span></td></tr><tr><td>Factors + integrated score</td><td class='num'>1.07</td><td class="num"><span class="sc-pos">+0.15</span></td></tr><tr><td>Factors + all eight theme blends</td><td class='num'>1.81</td><td class="num"><span class="sc-pos">+0.89</span></td></tr></tbody></table>The best single blend adds +0.15 to the factors' 0.93. Adding alleight theme blends at once reaches 1.81, but that number should not betrusted. It comes from an in-sample optimiser choosing twelve weights with hindsight, free to*short* the seasonality theme it now knows lost money. That is the sign flip the rest of the pagerefuses, done by an optimiser instead of by hand.## 6. The timing sleeveThe 45 market-timing rules are a separate kind of strategy, so they stay out of the blendsabove. Blended 1/N they earn Sharpe 0.06 at 1.7% volatility. Thefactors explain only 7% of that, with a market beta of+0.03 and alpha t = -0.56. They areuncorrelated with the factors, which is useful in principle, but there is no premium to harvest.## What this adds up toCombining signals works exactly as advertised on risk and not at all on return. The farmed libraryis diverse enough to diversify, about 15 independent bets, and blending it producessmooth, low-volatility return streams. But a blend converges on the average signal, and the averagefarmed signal does not earn its trading costs. What the blends *do* reliably hold is the classicfactors: long value, long momentum, short size, and that accounts for46–62% of their variance. That is a factor premium the combination genuinely harvests, and over Oct 2003–Jan 2024 it wasworth very little.The best result on the page, the integrated score book, is the one that concentrates thosefactor bets most. It earns a marginal alpha, and it wins a five-way comparison in which it was themost aggressive entrant.<div class="sc-warn"><strong>What this does not show.</strong> The common window starts in October 2003 becausethe adaptive blends need history to estimate from; single-signal results on the main page use thefull sample. The factors are equal-weighted tercile spreads built from this panel, not theFama-French series, so they share this universe's liquidity filter and exclude the smalleststocks. Costs are a flat 10bp on traded notional. The integrated book and the seasonality signals tradethe most, so a realistic cost model would hurt them the most. And the theme labels are a keywordmapping written for this page; a different taxonomy would move the theme-level numbers, though notthe library-wide blends.</div>## Reproduce```bashpython scripts/run_combination_study.py # ~10 min, writes runs/combination/python-c"from llm_alpha.reporting.combination_page import build; build()"```The blending rules live in `src/llm_alpha/backtest/combination.py`, where each adaptive rule has atest that shocks one month and checks that no earlier month moves.