Code
library(tidyverse)
library(PxWebApiData)
library(lubridate)
library(MetBrewer)
library(scales)

pal <- met.brewer("Hokusai2", 8)Norway’s municipalities are the frontline of the welfare state — running kindergartens, schools, elderly care, and local infrastructure. But beneath the surface of universal services lies a growing fiscal strain. Using detailed KOSTRA data (the municipal accounts database), we can see exactly where the money flows and where the pressure points are building.
library(tidyverse)
library(PxWebApiData)
library(lubridate)
library(MetBrewer)
library(scales)
pal <- met.brewer("Hokusai2", 8)df_kostra <- NULL
tryCatch({
raw <- ApiData(
"https://data.ssb.no/api/v0/no/table/12362",
KOKkommuneregion0000 = TRUE,
KOKfunksjon0000 = c("120", "201", "211", "213", "222", "234", "253", "254", "273", "335", "360", "386"),
KOKart0000 = "AGD2",
ContentsCode = "KOSbelopinnbygge0000",
Tid = list(filter = "top", values = 11)
)
tmp <- raw[[1]]
print(names(tmp))
time_col <- names(tmp)[grepl(
"tid|år|kvartal|måned|aar|maaned|year|month|quarter",
names(tmp), ignore.case = TRUE, perl = TRUE
)][1]
if (is.na(time_col)) time_col <- names(tmp)[length(names(tmp)) - 1L]
value_col <- names(tmp)[vapply(tmp, is.numeric, logical(1L))][1]
if (is.na(value_col)) value_col <- names(tmp)[length(names(tmp))]
func_col <- names(tmp)[grepl("funksjon", names(tmp), ignore.case = TRUE)][1]
region_col <- names(tmp)[grepl("kommune|region", names(tmp), ignore.case = TRUE)][1]
df_kostra <- tmp |>
mutate(
value = as.numeric(.data[[value_col]]),
time_str = .data[[time_col]],
year = as.integer(time_str),
function_code = .data[[func_col]],
region = .data[[region_col]]
) |>
filter(!is.na(value), !is.na(year))
}, error = function(e) message("KOSTRA fetch failed: ", e$message))[1] "region" "funksjon" "art"
[4] "statistikkvariabel" "år" "value"
[7] "NAstatus" if (!is.null(df_kostra)) {
function_labels <- c(
"120" = "Administration",
"201" = "Primary schools",
"211" = "Child welfare",
"213" = "Kindergartens",
"222" = "Elderly care (institutions)",
"234" = "Elderly care (home services)",
"253" = "Housing support",
"254" = "Health services",
"273" = "Child & family services",
"335" = "Culture",
"360" = "Roads & transport",
"386" = "Economic development"
)
df_kostra <- df_kostra |>
mutate(function_name = function_labels[function_code])
df_national <- df_kostra |>
group_by(year, function_name) |>
summarize(avg_spending = mean(value, na.rm = TRUE), .groups = "drop")
}if (!is.null(df_kostra)) {
spending_change <- df_national |>
filter(year %in% c(2015, 2025)) |>
pivot_wider(names_from = year, values_from = avg_spending, names_prefix = "y") |>
mutate(
change = y2025 - y2015,
pct_change = (y2025 / y2015 - 1) * 100
) |>
arrange(desc(change))
p1 <- ggplot(spending_change, aes(x = change, y = reorder(function_name, change))) +
geom_segment(
aes(x = 0, xend = change, yend = reorder(function_name, change)),
color = pal[3], linewidth = 0.8
) +
geom_point(aes(color = ifelse(change > 0, "Increase", "Decrease")), size = 4) +
scale_color_manual(values = c("Increase" = pal[1], "Decrease" = pal[6]), guide = "none") +
scale_x_continuous(labels = label_number(suffix = " kr", big.mark = " ")) +
labs(
title = "Elderly care and schools drove municipal spending growth, 2015-2025",
subtitle = "Change in net spending per capita across major municipal functions — institutional elderly care up 9,000 kr/person",
x = "Change in spending per capita (NOK)",
y = NULL,
caption = "Source: SSB KOSTRA (12362)"
) +
theme_minimal(base_size = 13) +
theme(
plot.title = element_text(face = "bold", size = 15),
panel.grid.major.y = element_blank(),
panel.grid.minor = element_blank()
)
print(p1)
}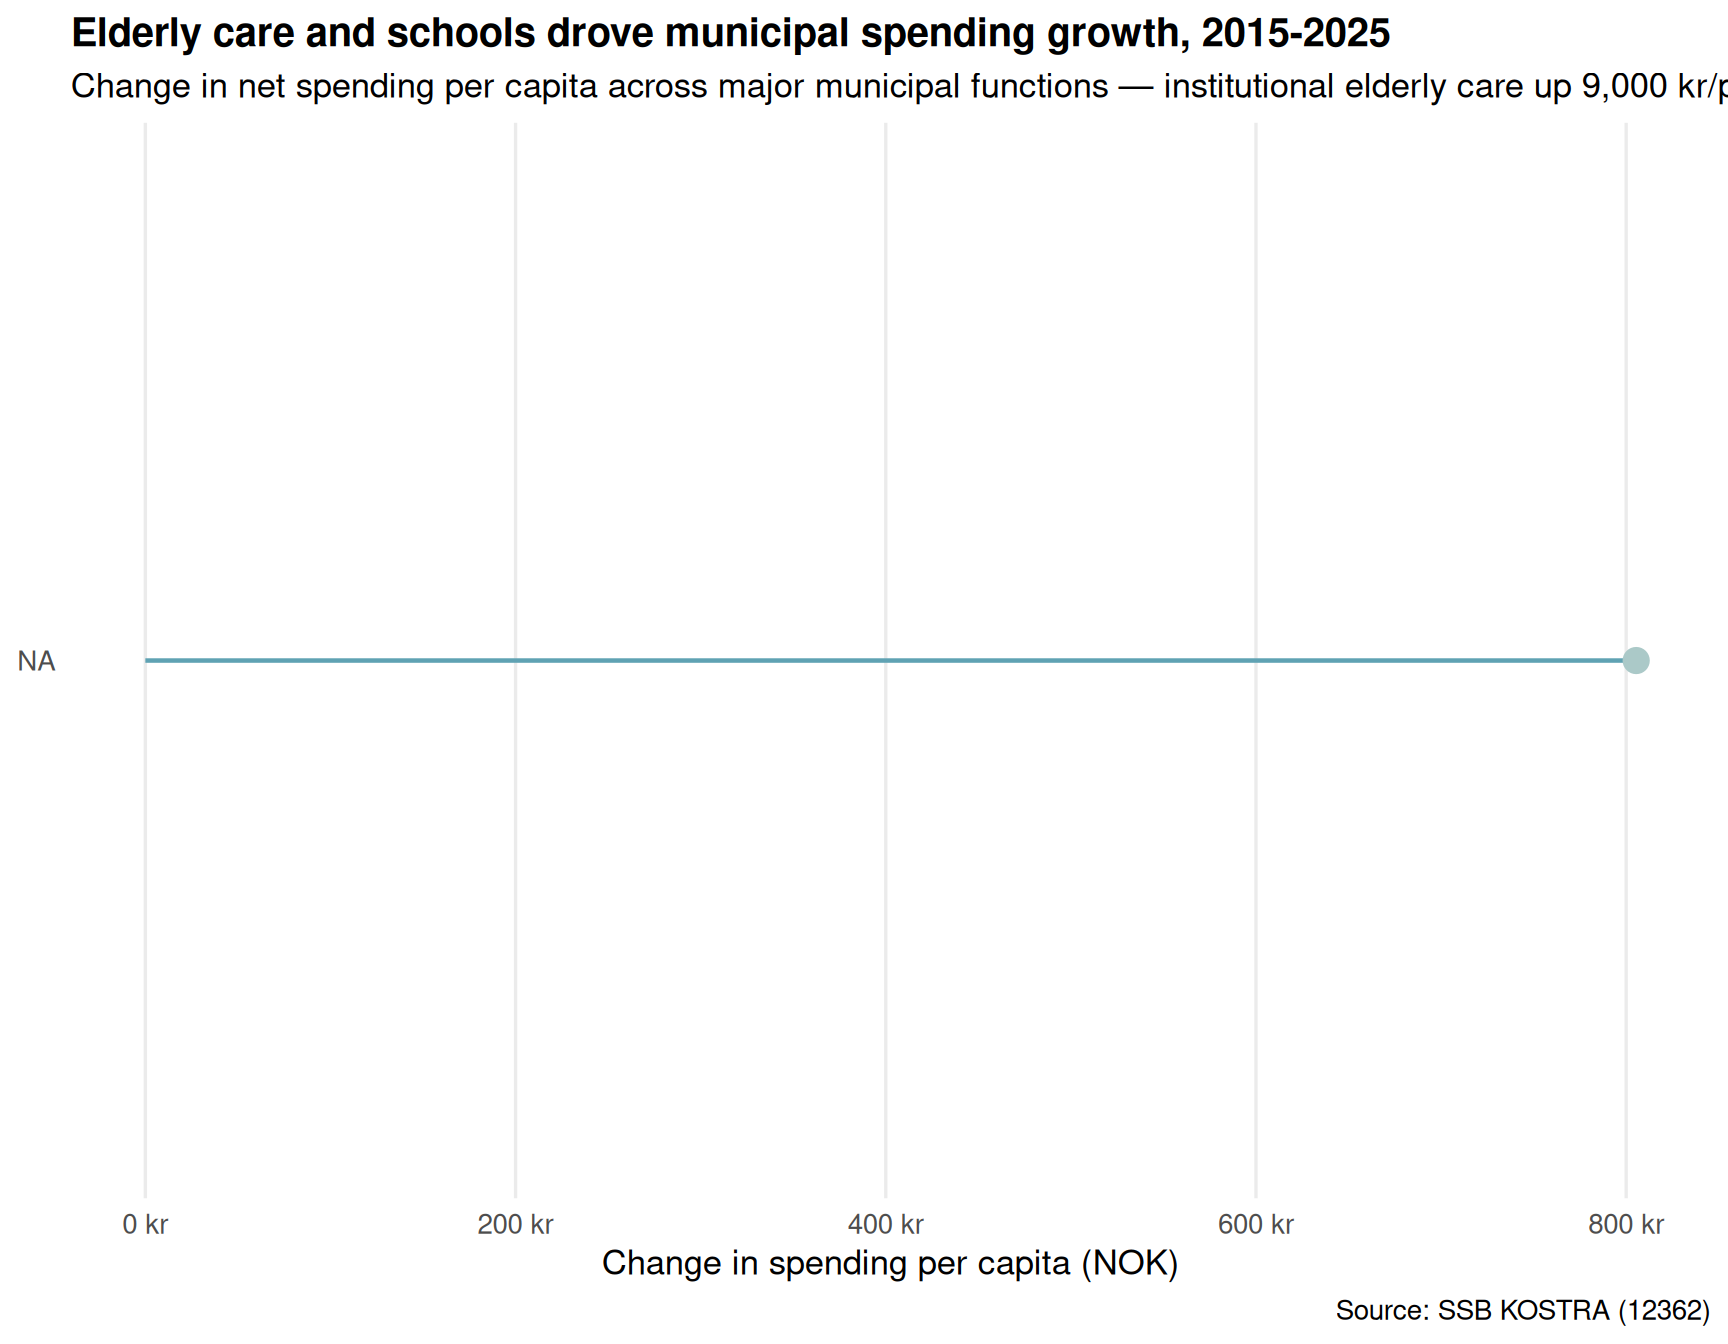
The waterfall is clear: institutional elderly care (+9,000 kr per capita), primary schools (+6,700 kr), and home-based elderly services (+3,700 kr) absorbed the bulk of new municipal spending over the decade. These are Norway’s demographic pressure points — an aging population requiring more care, delivered by municipalities with fixed tax bases.
if (!is.null(df_kostra)) {

  top_regions <- df_kostra |>
    filter(year == 2025) |>
    group_by(region) |>
    summarize(total = sum(value, na.rm = TRUE), .groups = "drop") |>
    arrange(desc(total)) |>
    slice_head(n = 15) |>
    pull(region)

  df_regions <- df_kostra |>
    filter(region %in% top_regions, function_code %in% c("222", "234", "201"))
}if (!is.null(df_kostra)) {
regional_change <- df_kostra |>
filter(year %in% c(2015, 2025), function_code == "222") |>
group_by(region, year) |>
summarize(spending = mean(value, na.rm = TRUE), .groups = "drop") |>
pivot_wider(names_from = year, values_from = spending, names_prefix = "y") |>
mutate(change = y2025 - y2015) |>
arrange(desc(change)) |>
slice_head(n = 12)
regional_long <- df_kostra |>
filter(year %in% c(2015, 2025), function_code == "222") |>
semi_join(regional_change, by = "region") |>
group_by(region, year) |>
summarize(spending = mean(value, na.rm = TRUE), .groups = "drop")
p2 <- ggplot(regional_long, aes(x = factor(year), y = spending, group = region)) +
geom_line(color = pal[4], alpha = 0.6, linewidth = 1) +
geom_point(color = pal[1], size = 3) +
geom_text(
data = regional_long |> filter(year == 2025),
aes(label = str_trunc(region, 20)),
hjust = -0.1, size = 3, color = pal[7]
) +
scale_y_continuous(labels = label_number(suffix = " kr", big.mark = " ")) +
scale_x_discrete(expand = expansion(mult = c(0.05, 0.25))) +
labs(
title = "Institutional elderly care costs surged across all major municipalities",
subtitle = "Net spending per capita on elderly care institutions, 2015 vs 2025 — pressure universal, not regional",
x = NULL,
y = "Spending per capita (NOK)",
caption = "Source: SSB KOSTRA (12362)"
) +
theme_minimal(base_size = 13) +
theme(
plot.title = element_text(face = "bold", size = 14),
panel.grid.major.x = element_blank(),
panel.grid.minor = element_blank()
)
print(p2)
}Error in `mutate()`:
ℹ In argument: `change = y2025 - y2015`.
Caused by error:
! object 'y2025' not foundThe slope chart reveals a crucial insight: this isn’t a story of regional winners and losers. Every major municipality saw institutional elderly care costs climb by 7,000-10,000 kr per capita. The pressure is systemic, not localized.
if (!is.null(df_kostra)) {

  heatmap_data <- df_national |>
    filter(!is.na(function_name)) |>
    group_by(function_name) |>
    mutate(
      indexed = (avg_spending / avg_spending[year == 2015]) * 100
    ) |>
    ungroup()

  p3 <- ggplot(heatmap_data, aes(x = year, y = reorder(function_name, avg_spending), fill = indexed)) +
    geom_tile(color = "white", linewidth = 0.5) +
    scale_fill_gradientn(
      colors = c(pal[6], "white", pal[1]),
      values = scales::rescale(c(90, 100, 150)),
      name = "Index\n(2015=100)",
      breaks = c(90, 100, 120, 140),
      limits = c(90, 150)
    ) +
    scale_x_continuous(breaks = seq(2015, 2025, 2)) +
    labs(
      title = "Municipal spending priorities shifted dramatically after 2020",
      subtitle = "Indexed spending per capita by function (2015=100) — elderly care accelerated while culture and development stalled",
      x = NULL,
      y = NULL,
      caption = "Source: SSB KOSTRA (12362)"
    ) +
    theme_minimal(base_size = 13) +
    theme(
      plot.title = element_text(face = "bold", size = 14),
      panel.grid = element_blank(),
      legend.position = "right"
    )

  print(p3)
}
The heatmap exposes the trade-offs: while elderly care and primary schools grew 30-40% above 2015 levels, culture, economic development, and housing support barely kept pace with inflation. Municipalities are rationing discretionary spending to fund mandated welfare services.
df_revenue <- NULL

tryCatch({
  raw_rev <- ApiData(
    "https://data.ssb.no/api/v0/no/table/10948",
    Eiersektor = c("03"),
    ContentsCode = TRUE,
    Tid = list(filter = "top", values = 60)
  )

  tmp_rev <- raw_rev[[1]]
  print(names(tmp_rev))

  time_col_rev <- names(tmp_rev)[grepl(
    "tid|år|kvartal|måned|aar|maaned|year|month|quarter",
    names(tmp_rev), ignore.case = TRUE, perl = TRUE
  )][1]
  if (is.na(time_col_rev)) time_col_rev <- names(tmp_rev)[length(names(tmp_rev)) - 1L]

  value_col_rev <- names(tmp_rev)[vapply(tmp_rev, is.numeric, logical(1L))][1]
  if (is.na(value_col_rev)) value_col_rev <- names(tmp_rev)[length(names(tmp_rev))]

  df_revenue <- tmp_rev |>
    mutate(
      value = as.numeric(.data[[value_col_rev]]),
      time_str = .data[[time_col_rev]],
      date = case_when(
        stringr::str_detect(time_str, "M") ~ lubridate::ym(sub("M", "-", time_str)),
        nchar(time_str) == 4 ~ lubridate::ymd(paste0(time_str, "-01-01")),
        TRUE ~ NA_Date_
      )
    ) |>
    filter(!is.na(value), !is.na(date))

}, error = function(e) message("Revenue fetch failed: ", e$message))
[1] "eiersektor" "statistikkvariabel" "måned"
[4] "value" if (!is.null(df_revenue)) {
if ("eiersektor" %in% names(df_revenue)) {
sector_col <- "eiersektor"
} else {
sector_col <- names(df_revenue)[grepl("sektor", names(df_revenue), ignore.case = TRUE)][1]
}
content_col <- names(df_revenue)[grepl("contents|innhold", names(df_revenue), ignore.case = TRUE)][1]
df_rev_plot <- df_revenue |>
filter(year(date) >= 2015) |>
mutate(year = year(date))
sample_data <- df_rev_plot |>
group_by(year) |>
slice_sample(n = min(30, n())) |>
ungroup()
p4 <- ggplot(sample_data, aes(x = year, y = value / 1000)) +
geom_point(
aes(color = .data[[content_col]]),
size = 3, alpha = 0.6,
position = position_jitter(width = 0.2, height = 0)
) +
scale_color_manual(values = pal, name = NULL) +
scale_x_continuous(breaks = seq(2015, 2026, 2)) +
scale_y_continuous(labels = label_number(suffix = " bn", big.mark = " ")) +
labs(
title = "Municipal government cash flows show mounting volatility",
subtitle = "Monthly transactions in the municipal sector, 2015-2026 — revenue and expenditure patterns increasingly erratic",
x = NULL,
y = "Value (billion NOK)",
caption = "Source: SSB (10948)"
) +
theme_minimal(base_size = 13) +
theme(
plot.title = element_text(face = "bold", size = 14),
legend.position = "bottom",
legend.text = element_text(size = 9),
panel.grid.minor = element_blank()
)
print(p4)
}Error in `slice_sample()`:
! `n` must be a constant.
Caused by error in `n()`:
! Must only be used inside data-masking verbs like `mutate()`,
`filter()`, and `group_by()`.Municipal government finances show increasing month-to-month volatility in both revenues and expenditures. This cash flow turbulence reflects the tension between stable tax income and lumpy, demand-driven spending on welfare services.
Norway’s municipalities are caught between demographic destiny and fiscal reality. An aging population requires more care precisely when the working-age tax base is shrinking in many regions. The KOSTRA data shows municipalities have responded by protecting core welfare services — elderly care, schools, kindergartens — while quietly rationing everything else.
The question for 2026 and beyond: how long can this rationing continue before it affects service quality? And will central government step in with new funding formulas, or will municipalities face harder choices about which universal services remain truly universal?