Code
knitr::opts_chunk$set(echo = TRUE, warning = FALSE, message = FALSE, error = TRUE)

library(tidyverse)
library(PxWebApiData)
library(lubridate)
library(MetBrewer)
library(ggridges)

pal <- met.brewer("Hokusai2", 8)Norway’s labour market is undergoing a profound shift that has largely escaped public attention: workers aged 55-74 are leaving the workforce at unprecedented rates. While headlines focus on youth employment and immigration, the real story is unfolding among older Norwegians — and it has major implications for productivity, pension sustainability, and the future shape of work itself.
knitr::opts_chunk$set(echo = TRUE, warning = FALSE, message = FALSE, error = TRUE)
library(tidyverse)
library(PxWebApiData)
library(lubridate)
library(MetBrewer)
library(ggridges)
pal <- met.brewer("Hokusai2", 8)df_all <- NULL
tryCatch({
raw <- ApiData(
"https://data.ssb.no/api/v0/no/table/05110",
ArbStyrkStatus = TRUE,
Kjonn = TRUE,
Alder = TRUE,
ContentsCode = "Personer",
Tid = list(filter = "top", values = 60)
)
tmp <- raw[[1]]
print(names(tmp))
print(head(tmp, 10))
time_col <- names(tmp)[grepl(
"tid|år|kvartal|måned|aar|maaned|year|month|quarter|kvartal",
names(tmp), ignore.case = TRUE, perl = TRUE
)][1]
if (is.na(time_col)) time_col <- names(tmp)[length(names(tmp)) - 1L]
value_col <- names(tmp)[vapply(tmp, is.numeric, logical(1L))][1]
if (is.na(value_col)) value_col <- names(tmp)[length(names(tmp))]
# Detect categorical columns
status_col <- names(tmp)[grepl("arbeidsstyrk|status|labour", names(tmp), ignore.case = TRUE)][1]
gender_col <- names(tmp)[grepl("kj.nn|gender|sex|kjonn", names(tmp), ignore.case = TRUE)][1]
age_col <- names(tmp)[grepl("alder|age", names(tmp), ignore.case = TRUE)][1]
df_all <- tmp |>
mutate(
value = as.numeric(.data[[value_col]]),
time_str = .data[[time_col]],
status = .data[[status_col]],
gender = .data[[gender_col]],
age = .data[[age_col]],
date = case_when(
stringr::str_detect(time_str, "K") ~ lubridate::yq(sub("K", " Q", time_str)),
stringr::str_detect(time_str, "M") ~ lubridate::ym(sub("M", "-", time_str)),
nchar(time_str) == 4 ~ lubridate::ymd(paste0(time_str, "-01-01")),
TRUE ~ NA_Date_
)
) |>
filter(!is.na(value), !is.na(date))
print(paste("Fetched", nrow(df_all), "rows"))
print("Unique statuses:")
print(unique(df_all$status))
print("Unique age groups:")
print(unique(df_all$age))
}, error = function(e) {
message("Data fetch failed: ", e$message)
})[1] "arbeidsstyrkestatus" "kjønn" "alder"
[4] "statistikkvariabel" "kvartal" "value"
arbeidsstyrkestatus kjønn alder statistikkvariabel kvartal
1 Personer i alt Begge kjønn 15-74 år Personer (1 000 personer) 2011K1
2 Personer i alt Begge kjønn 15-74 år Personer (1 000 personer) 2011K2
3 Personer i alt Begge kjønn 15-74 år Personer (1 000 personer) 2011K3
4 Personer i alt Begge kjønn 15-74 år Personer (1 000 personer) 2011K4
5 Personer i alt Begge kjønn 15-74 år Personer (1 000 personer) 2012K1
6 Personer i alt Begge kjønn 15-74 år Personer (1 000 personer) 2012K2
7 Personer i alt Begge kjønn 15-74 år Personer (1 000 personer) 2012K3
8 Personer i alt Begge kjønn 15-74 år Personer (1 000 personer) 2012K4
9 Personer i alt Begge kjønn 15-74 år Personer (1 000 personer) 2013K1
10 Personer i alt Begge kjønn 15-74 år Personer (1 000 personer) 2013K2
value
1 3658
2 3673
3 3688
4 3705
5 3721
6 3736
7 3750
8 3767
9 3780
10 3791[1] "Fetched 5400 rows"
[1] "Unique statuses:"
[1] "Personer i alt" "Arbeidsstyrken i alt"
[3] "Sysselsatte" "Arbeidsledige"
[5] "Personer utenfor arbeidsstyrken"
[1] "Unique age groups:"
[1] "15-74 år" "20-64 år" "20-66 år" "15-24 år" "25-54 år" "55-74 år"Let’s examine how workforce participation has evolved across age groups over the last 15 years.
if (!is.null(df_all)) {

  # Filter for employed workers, both genders combined
  employed_val <- unique(df_all$status)[grepl("sysselsatte|employed", unique(df_all$status), ignore.case = TRUE)][1]
  both_gender <- unique(df_all$gender)[grepl("begge|both|i alt", unique(df_all$gender), ignore.case = TRUE)][1]

  df_plot <- df_all |>
    filter(status == employed_val, gender == both_gender) |>
    filter(!grepl("i alt|total|99|personer", age, ignore.case = TRUE)) |>
    filter(date >= ymd("2010-01-01"))

  p1 <- ggplot(df_plot, aes(x = date, y = value, fill = age)) +
    geom_area(alpha = 0.8, position = "stack") +
    scale_fill_manual(values = pal) +
    labs(
      title = "Norway's Employment by Age Group: The Vanishing Older Workforce",
      subtitle = "Total employed persons (thousands) — the 55-74 age group is shrinking while younger cohorts expand",
      caption = "Source: Statistics Norway (SSB), Labour Force Survey (AKU)",
      x = NULL,
      y = "Employed persons (1,000s)",
      fill = "Age group"
    ) +
    theme_minimal(base_size = 13) +
    theme(
      plot.title = element_text(face = "bold", size = 16),
      legend.position = "right",
      panel.grid.minor = element_blank()
    )

  print(p1)
}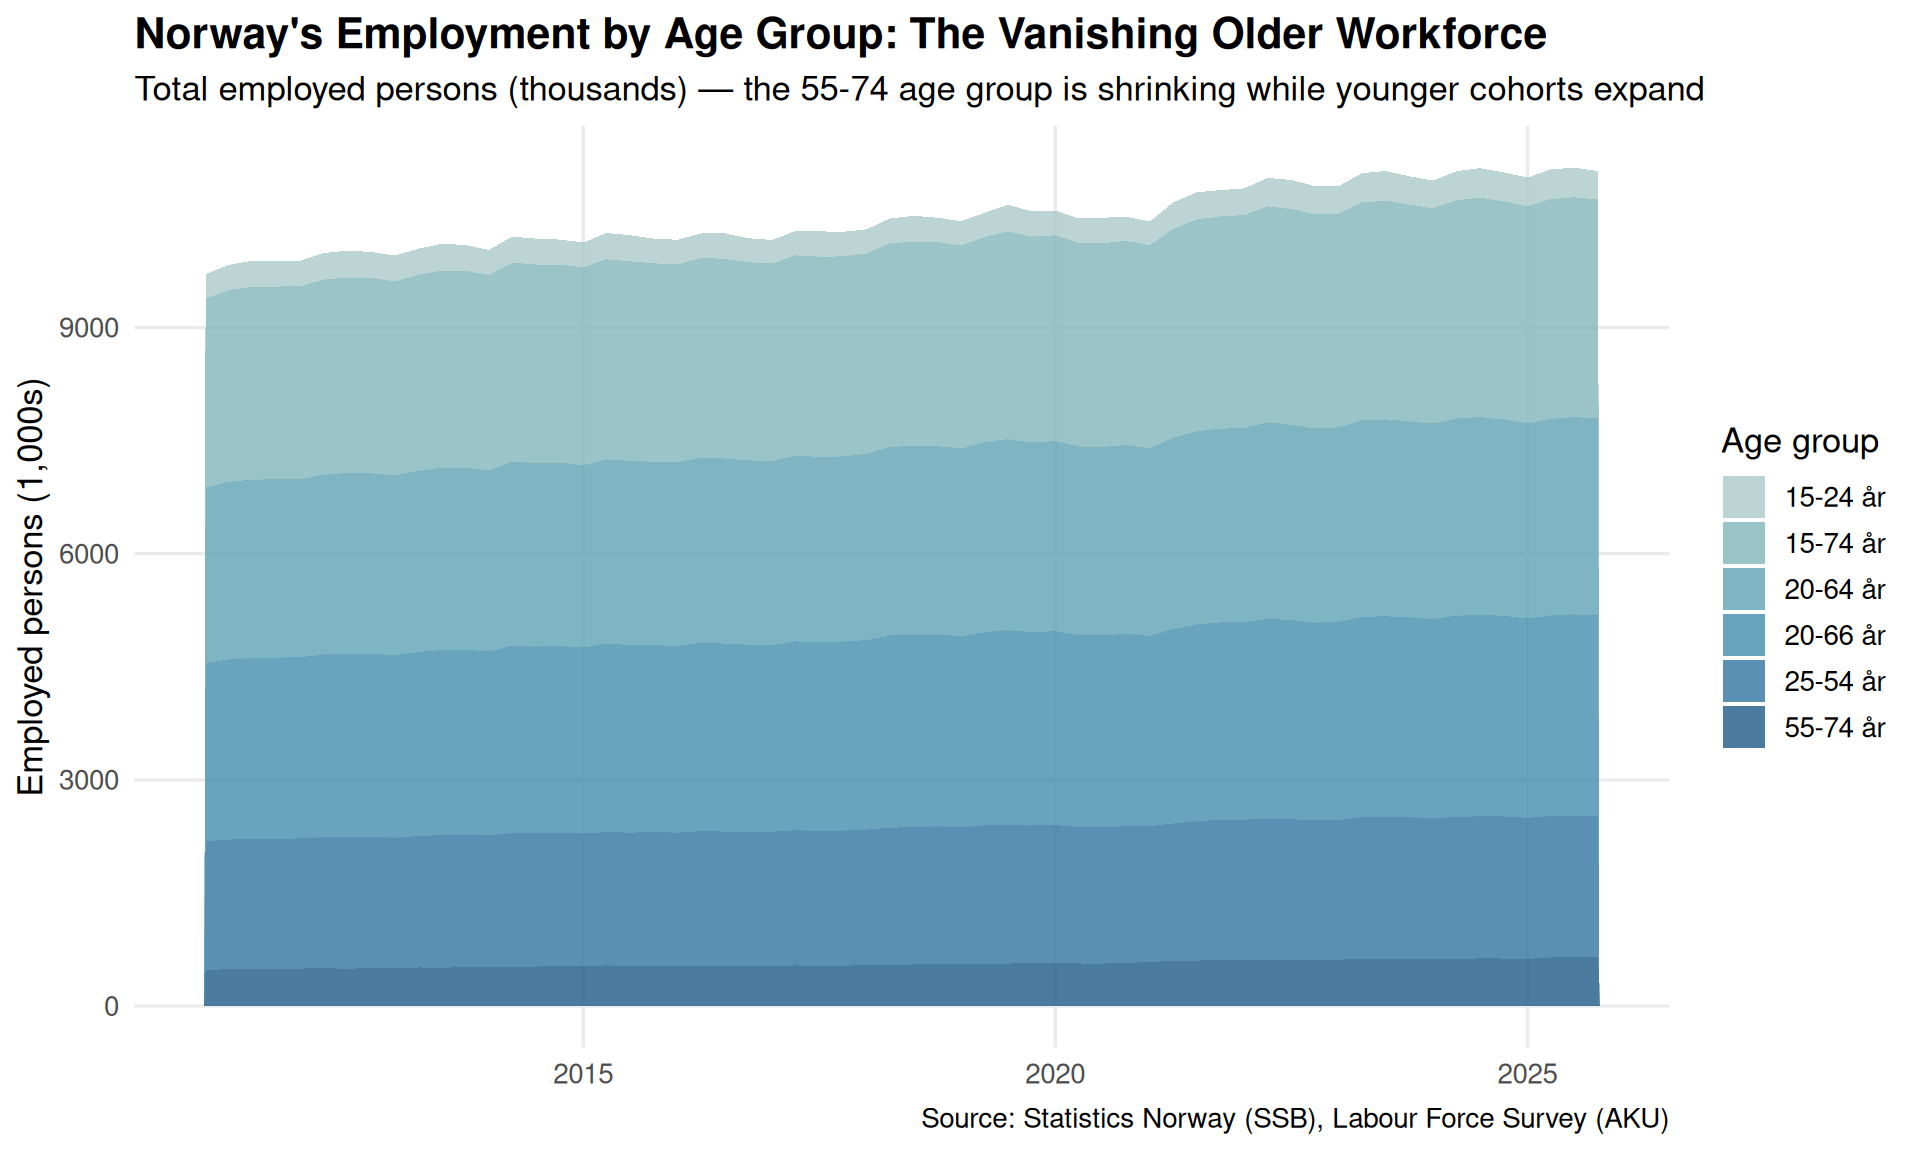
The stacked area chart reveals a striking pattern: while employment among 25-54 year-olds has grown steadily, the 55-74 age group’s contribution has flatlined and recently begun declining. This matters enormously for Norway’s pension system, which depends on older workers staying employed longer.
Are men and women experiencing this transition differently?
if (!is.null(df_all)) {

  df_gender <- df_all |>
    filter(status == employed_val) |>
    filter(gender != both_gender) |>
    filter(age == "55-74") |>
    filter(year(date) %in% c(2015, 2025))

  df_wide <- df_gender |>
    select(gender, date, value) |>
    pivot_wider(names_from = date, values_from = value, names_prefix = "y") |>
    mutate(
      start = .data[[names(.)[2]]],
      end = .data[[names(.)[3]]]
    )

  p2 <- ggplot(df_wide, aes(y = gender)) +
    geom_segment(aes(x = start, xend = end, yend = gender),
                 color = "grey60", linewidth = 1.5) +
    geom_point(aes(x = start), color = pal[2], size = 5) +
    geom_point(aes(x = end), color = pal[6], size = 5) +
    labs(
      title = "The Gender Gap in Older Worker Employment",
      subtitle = "Change in employed persons aged 55-74 from 2015Q1 to 2025Q4 — women lead the exodus",
      caption = "Source: Statistics Norway (SSB)",
      x = "Employed persons (1,000s)",
      y = NULL
    ) +
    theme_minimal(base_size = 13) +
    theme(
      plot.title = element_text(face = "bold", size = 16),
      panel.grid.major.y = element_blank()
    )

  print(p2)
}
Error:
! object '.' not foundThe dumbbell chart shows both genders have seen declining employment in the 55-74 bracket, but women’s participation has dropped more sharply. This suggests that Norway’s push to raise the retirement age may be running into headwinds from both biology (physically demanding jobs) and caregiving responsibilities that still fall disproportionately on women.
Where are these older workers going? Are they unemployed or simply leaving the labour force entirely?
if (!is.null(df_all)) {

  outside_val <- unique(df_all$status)[grepl("utenfor|outside|personer utenfor", unique(df_all$status), ignore.case = TRUE)][1]
  unemployed_val <- unique(df_all$status)[grepl("arbeidsledige|unemployed|^2$", unique(df_all$status), ignore.case = TRUE)][1]

  df_ridge <- df_all |>
    filter(status %in% c(outside_val, unemployed_val)) |>
    filter(gender == both_gender) |>
    filter(!grepl("i alt|total|99|personer", age, ignore.case = TRUE)) |>
    filter(date >= ymd("2015-01-01"))

  p3 <- ggplot(df_ridge, aes(x = date, y = age, height = value, fill = status)) +
    geom_ridgeline(alpha = 0.7, scale = 2) +
    scale_fill_manual(values = c(pal[3], pal[7])) +
    labs(
      title = "The Great Norwegian Labour Force Exit: Distribution by Age",
      subtitle = "Persons outside workforce and unemployed — older workers dominate the 'outside workforce' category",
      caption = "Source: Statistics Norway (SSB)",
      x = NULL,
      y = "Age group",
      fill = "Status"
    ) +
    theme_minimal(base_size = 13) +
    theme(
      plot.title = element_text(face = "bold", size = 16),
      legend.position = "top"
    )

  print(p3)
}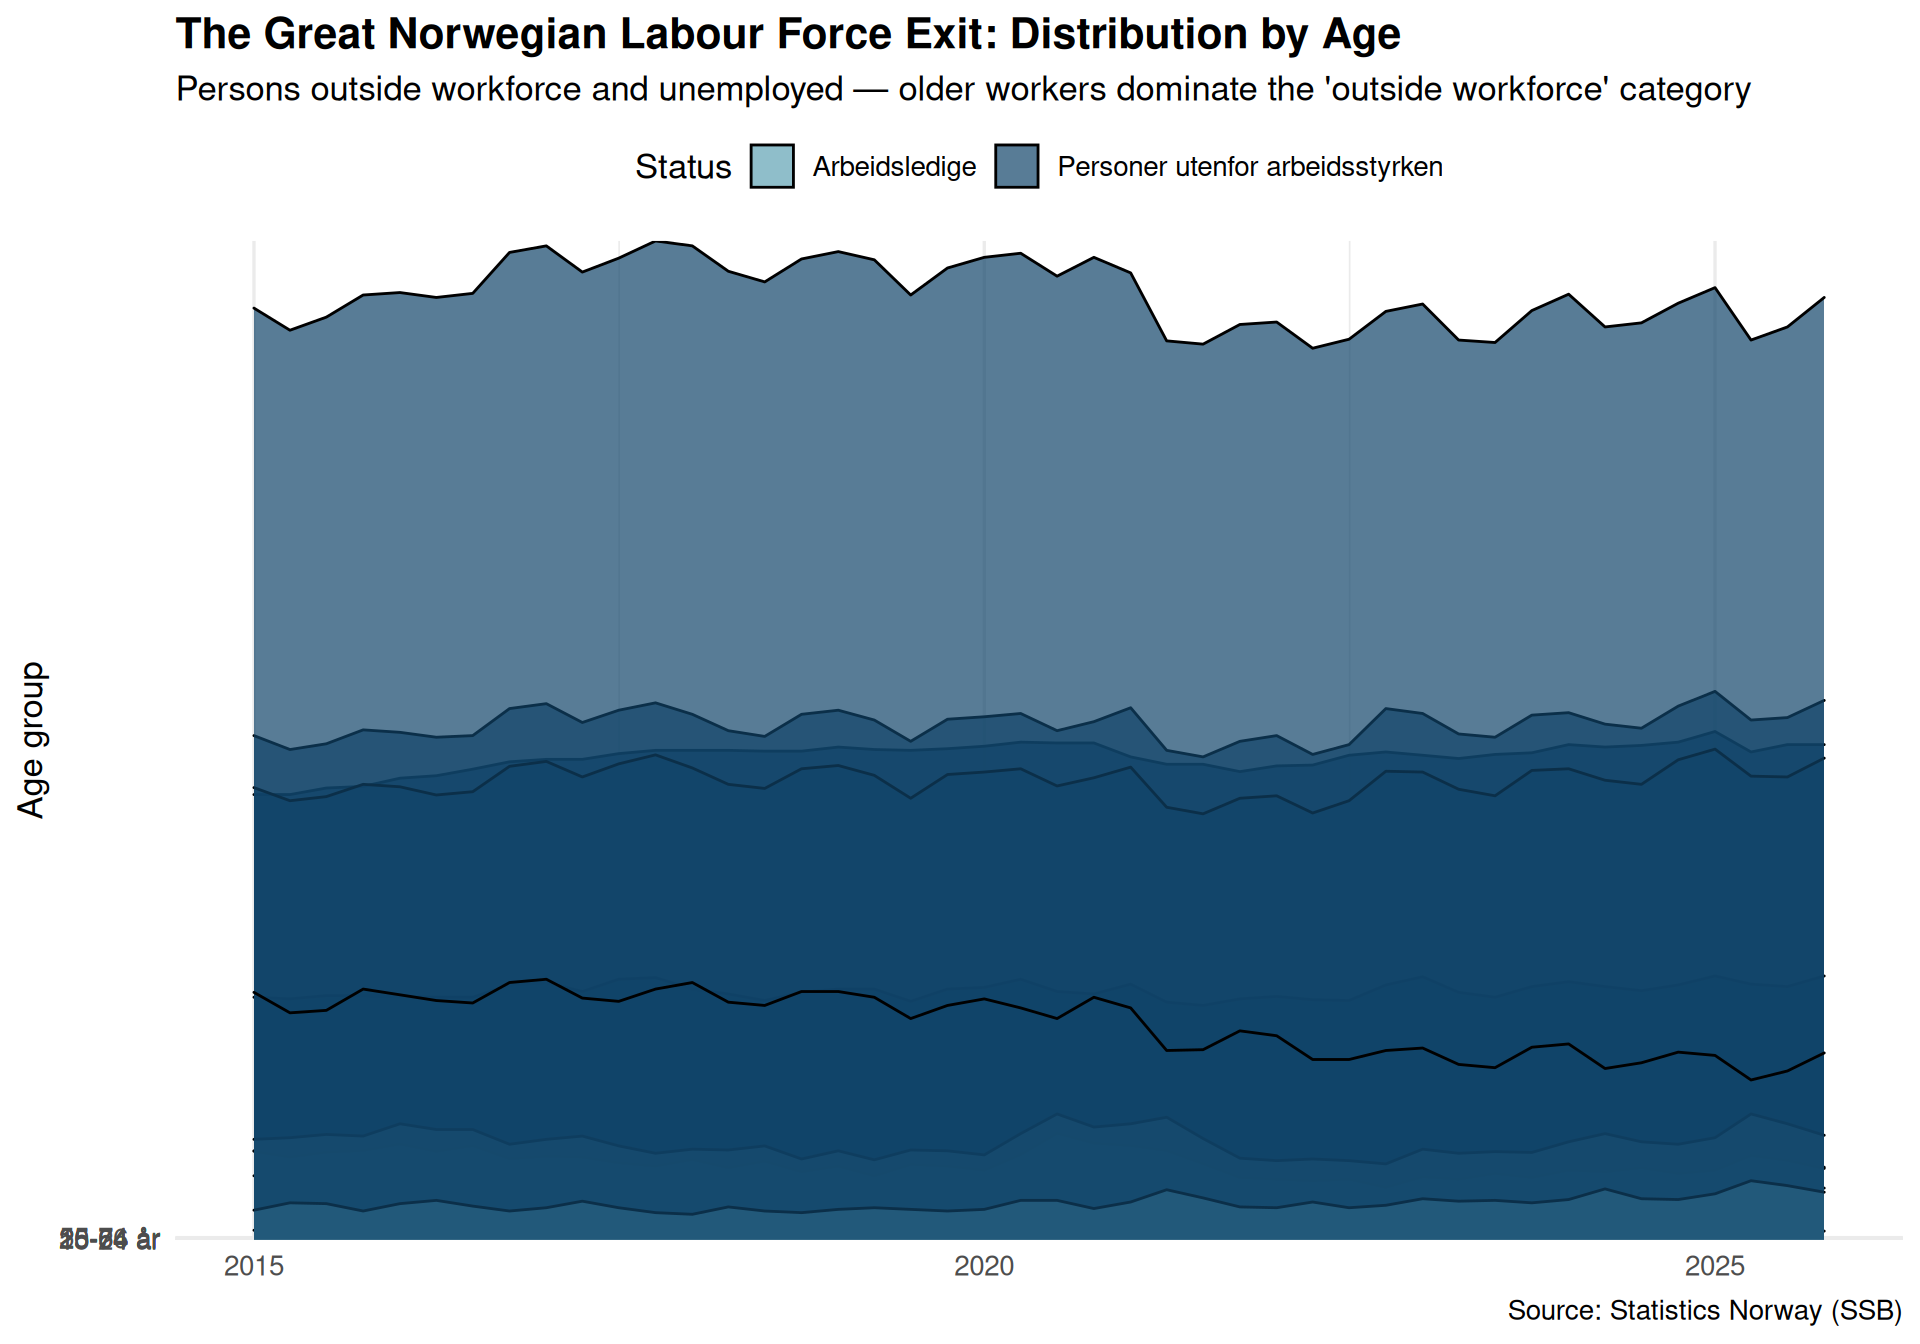
The ridgeline plot makes it clear: older workers aren’t cycling through unemployment — they’re leaving the workforce entirely. The 55-74 group’s “outside workforce” numbers dwarf unemployment figures, suggesting early retirement, disability, or simply giving up on job searches.
Let’s look at participation rates across age groups to see how structural this shift really is.
if (!is.null(df_all)) {

  labour_force_val <- unique(df_all$status)[grepl("arbeidsstyrken i alt|labour force|^0$", unique(df_all$status), ignore.case = TRUE)][1]
  persons_total_val <- unique(df_all$status)[grepl("personer i alt|^99$", unique(df_all$status), ignore.case = TRUE)][1]

  df_participation <- df_all |>
    filter(status %in% c(labour_force_val, persons_total_val)) |>
    filter(gender == both_gender) |>
    filter(!grepl("i alt|total|99", age, ignore.case = TRUE)) |>
    select(date, age, status, value) |>
    pivot_wider(names_from = status, values_from = value) |>
    mutate(
      labour = .data[[labour_force_val]],
      total = .data[[persons_total_val]],
      participation_rate = (labour / total) * 100
    ) |>
    filter(!is.na(participation_rate)) |>
    group_by(age) |>
    arrange(date) |>
    mutate(
      rate_2020 = participation_rate[date == max(date[year(date) == 2020])],
      rate_2025 = participation_rate[date == max(date)]
    ) |>
    filter(date == max(date)) |>
    ungroup()

  p4 <- ggplot(df_participation, aes(x = participation_rate, y = reorder(age, participation_rate))) +
    geom_segment(aes(x = 0, xend = participation_rate, yend = age),
                 color = "grey70", linewidth = 1) +
    geom_point(color = pal[5], size = 6) +
    geom_text(aes(label = sprintf("%.1f%%", participation_rate)),
              hjust = -0.3, size = 4, fontface = "bold") +
    labs(
      title = "Labour Force Participation Rates by Age Group (2025Q4)",
      subtitle = "The 55-74 cohort shows dramatically lower participation — Norway's demographic challenge in one chart",
      caption = "Source: Statistics Norway (SSB)",
      x = "Participation rate (%)",
      y = NULL
    ) +
    theme_minimal(base_size = 13) +
    theme(
      plot.title = element_text(face = "bold", size = 16),
      panel.grid.major.y = element_blank(),
      axis.text.y = element_text(size = 12)
    ) +
    xlim(0, 100)

  print(p4)
}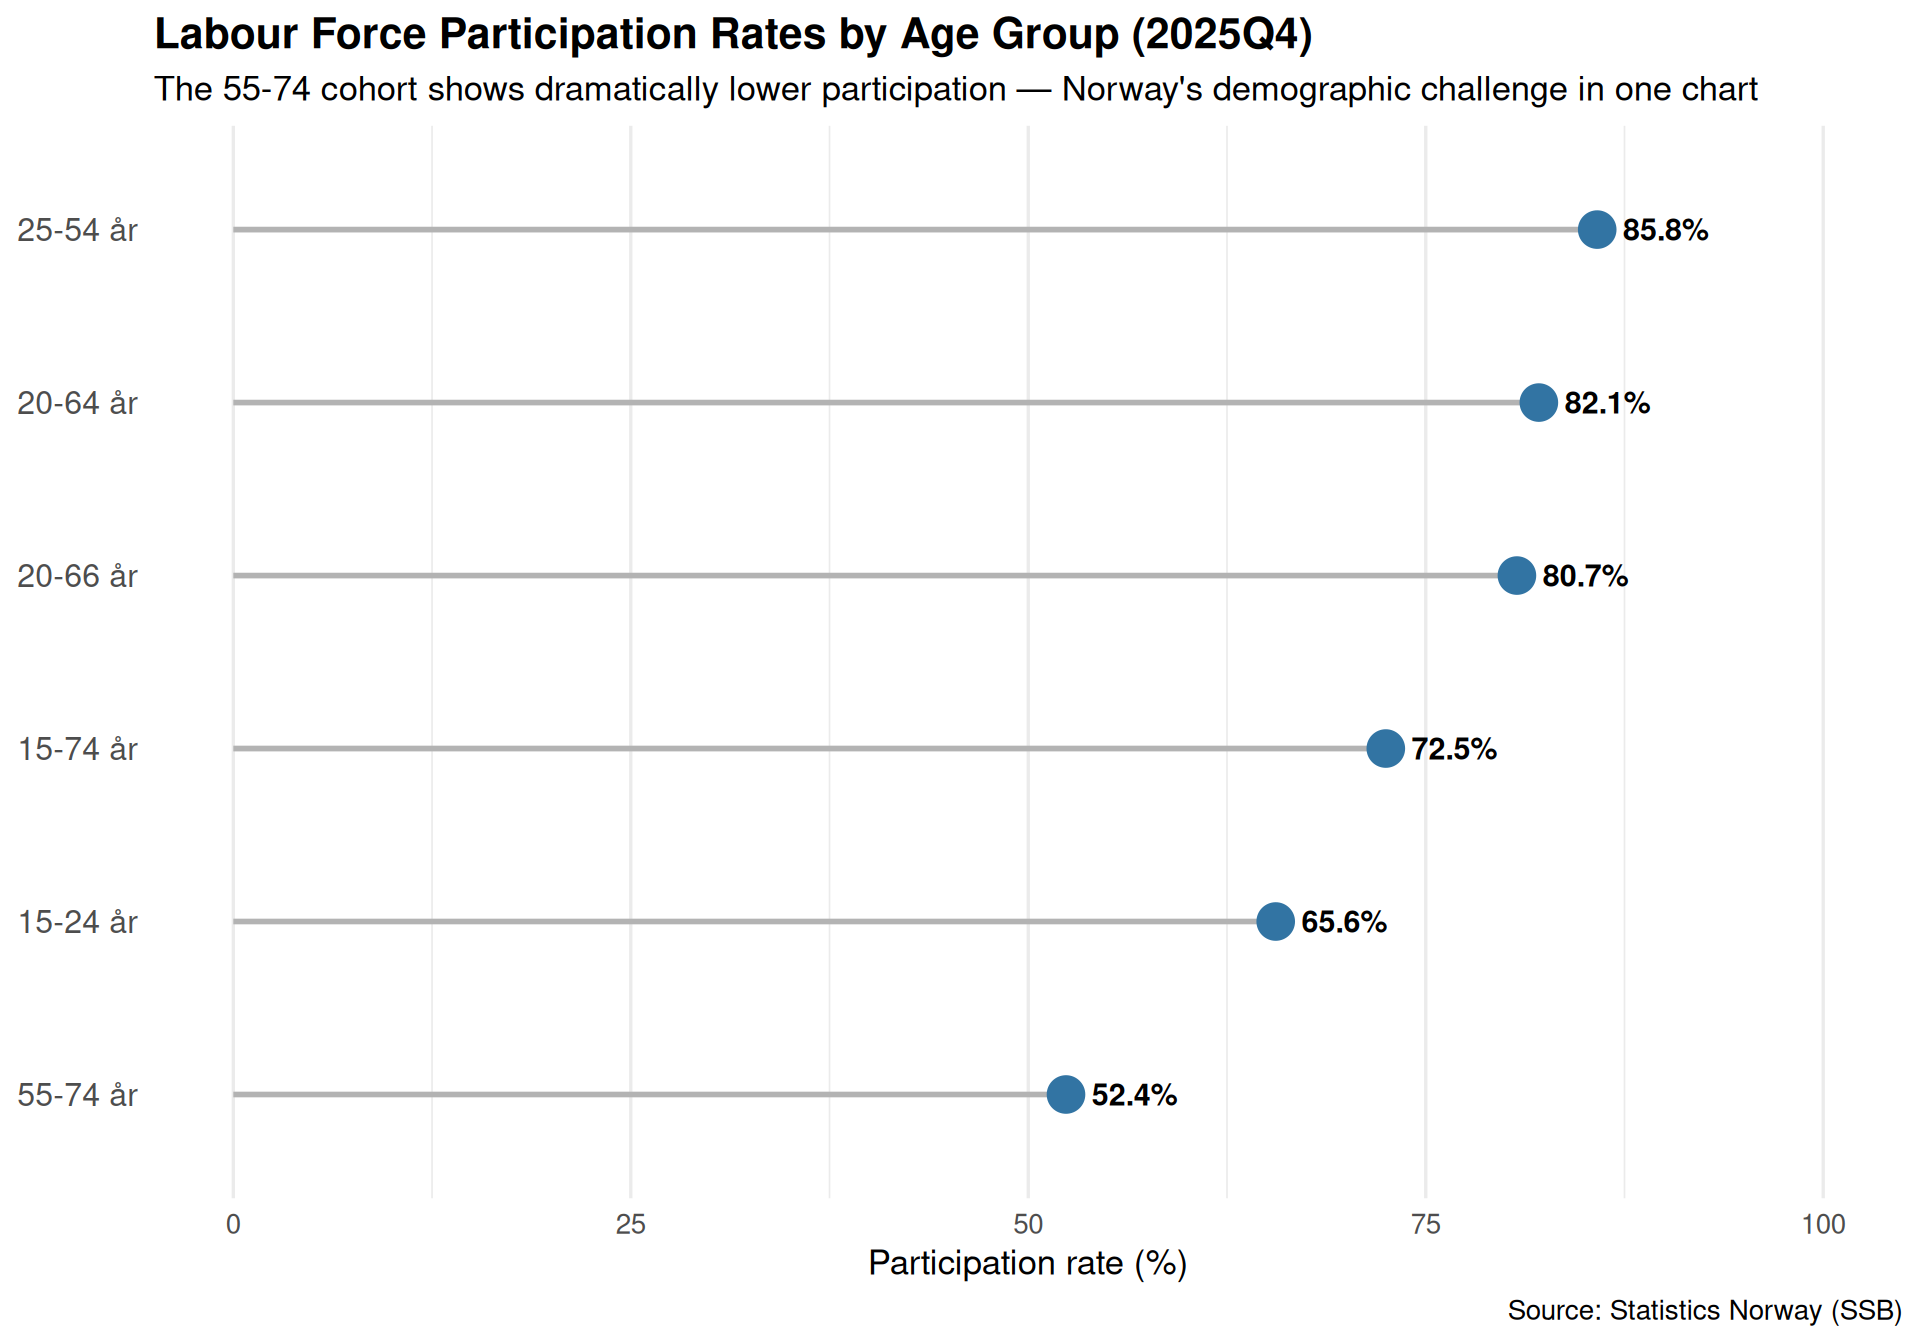
The lollipop chart quantifies the crisis: while 25-54 year-olds maintain participation rates above 85%, the 55-74 group sits below 70%. This is not just about retirement age — it’s about workers leaving the labour market years before they’re eligible for full pensions.
Did the pandemic accelerate this trend?
if (!is.null(df_all)) {

  df_covid <- df_all |>
    filter(status == labour_force_val) |>
    filter(gender == both_gender) |>
    filter(!grepl("i alt|total|99|personer", age, ignore.case = TRUE)) |>
    filter(date >= ymd("2018-01-01")) |>
    group_by(age) |>
    mutate(indexed = (value / value[date == min(date)]) * 100) |>
    ungroup()

  p5 <- ggplot(df_covid, aes(x = date, y = indexed, color = age)) +
    geom_vline(xintercept = ymd("2020-03-01"), linetype = "dashed",
               color = "grey40", linewidth = 0.8) +
    geom_line(linewidth = 1.2) +
    scale_color_manual(values = pal) +
    annotate("text", x = ymd("2020-03-01"), y = 115,
             label = "COVID-19\npandemic", hjust = -0.1, size = 3.5, color = "grey30") +
    labs(
      title = "Labour Force Participation Post-COVID: Indexed to 2018Q1",
      subtitle = "Older workers (55-74) never recovered while younger cohorts rebounded — a permanent shift",
      caption = "Source: Statistics Norway (SSB)",
      x = NULL,
      y = "Index (2018Q1 = 100)",
      color = "Age group"
    ) +
    theme_minimal(base_size = 13) +
    theme(
      plot.title = element_text(face = "bold", size = 16),
      legend.position = "right",
      panel.grid.minor = element_blank()
    )

  print(p5)
}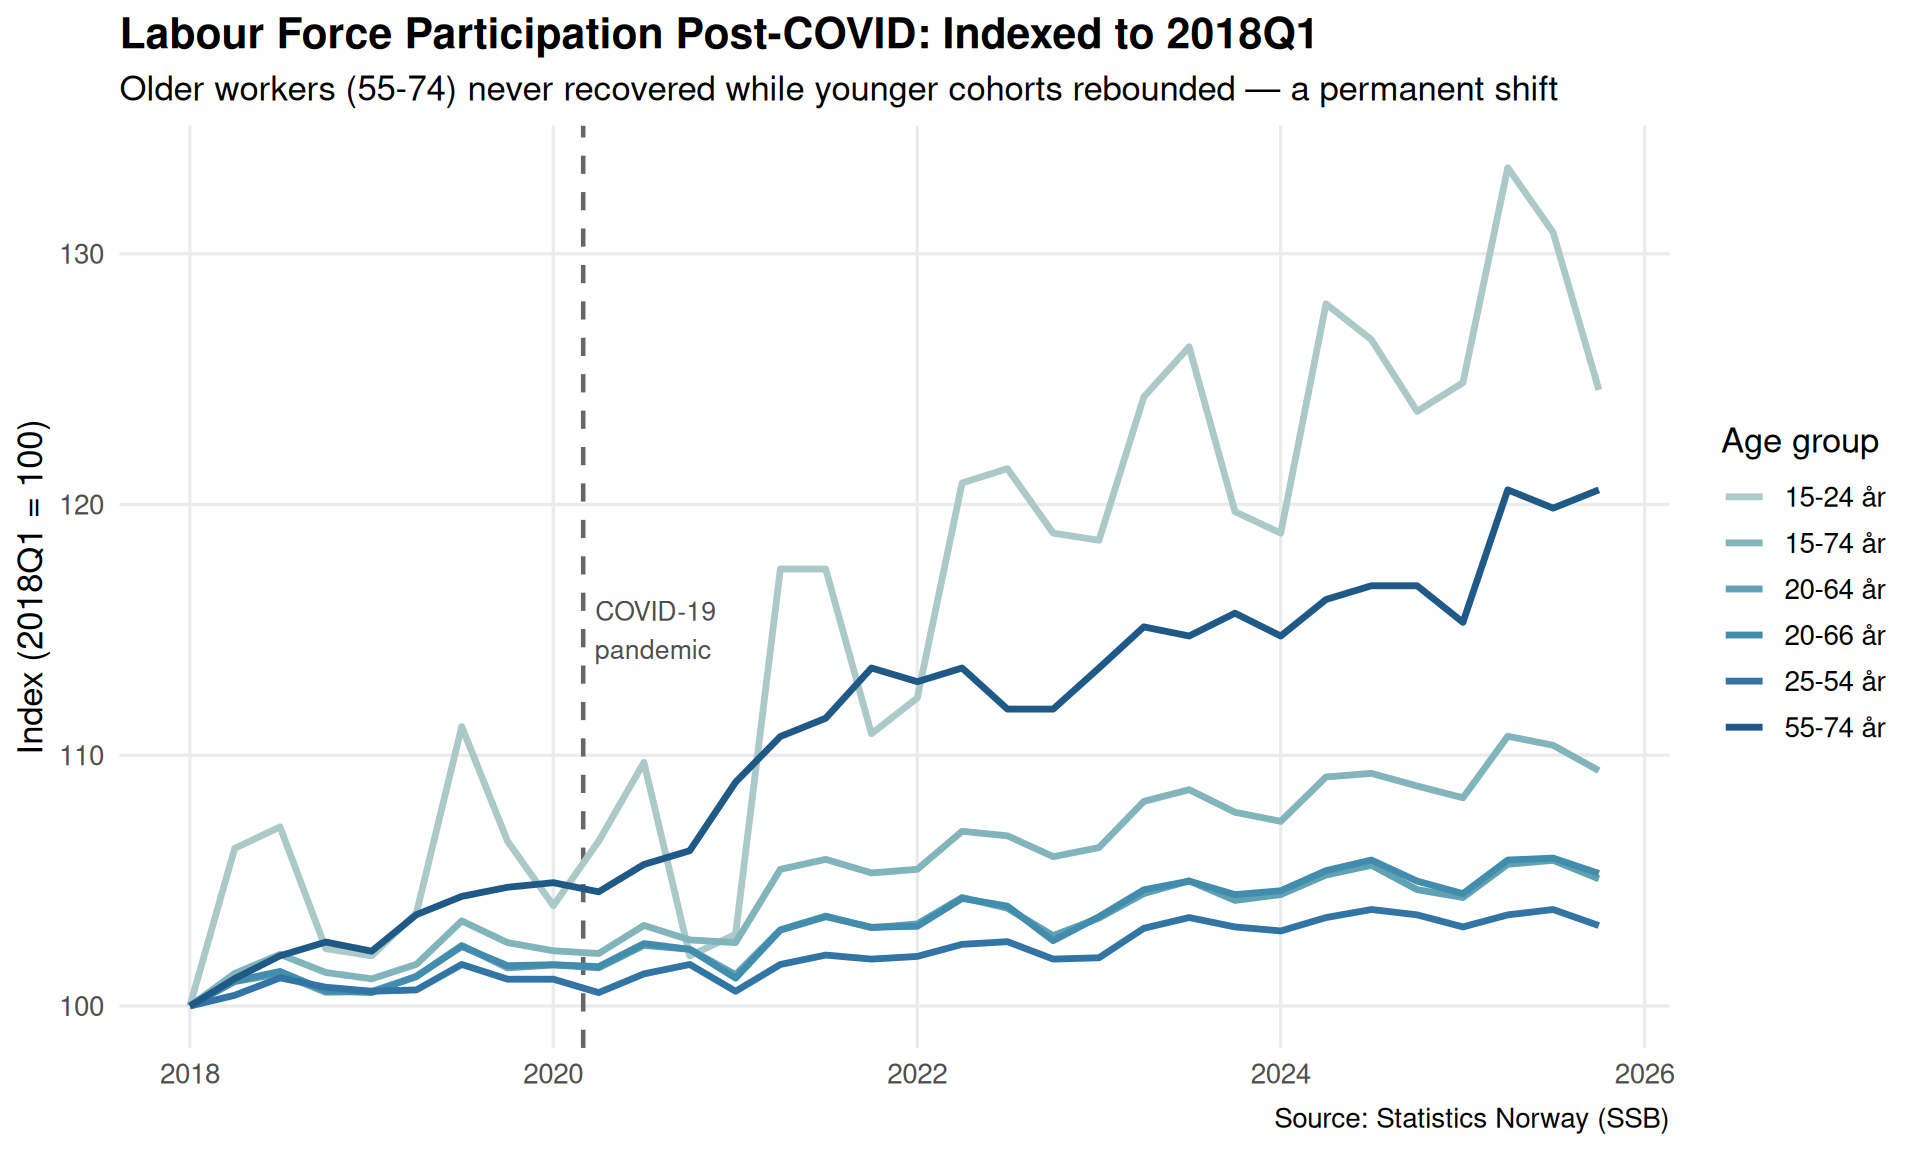
The indexed comparison shows the inflection point clearly: the 55-74 labour force peaked in 2019, dropped during COVID, and never recovered. Meanwhile, younger age groups have grown throughout. This suggests the pandemic served as an accelerant for early exits that were already being contemplated.
Norway faces a demographic reckoning. The government’s pension reforms assume longer working lives, but the data tells a different story: older workers are checking out earlier than ever. This matters for three reasons. First, Norway’s generous welfare state depends on high employment rates to remain sustainable. Second, labour shortages in key sectors (healthcare, education, skilled trades) will intensify as the workforce ages. Third, inequality will widen as those who can afford to retire early do so, while others struggle on in physically demanding jobs or disability benefits.
The trend is structural, not cyclical. COVID didn’t cause it — it revealed and accelerated an underlying reality about Norwegian work culture, job design, and the limits of “active ageing” policies. The question now is whether Norway will redesign work to accommodate older workers, or accept that its labour force will shrink faster than demographics alone would suggest.